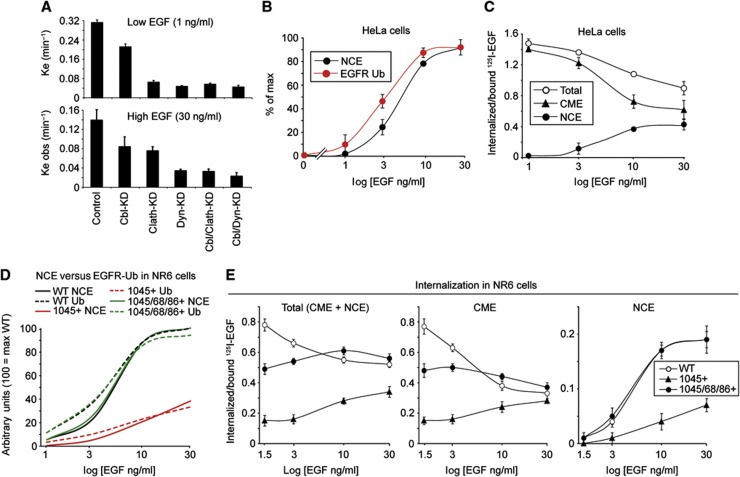
Figure 9.
EGFR ubiquitination and EGFR-NCE are mechanistically linked. (A) 125I-EGF internalization kinetics in control HeLa cells or upon KD of the indicated proteins at low (1 ng/ml, top) or high EGF dose (30 ng/ml, bottom). Results are expressed as internalization rate constants (Ke or Ke obs, see Supplementary Experimental Procedures) and are the mean of triplicate experiments. (B) Dose–response curves of EGFR-NCE and EGFR ubiquitination (measured by ELISA, forward approach) in HeLa cells. (B) Dose–response curves of 125I-EGF internalization in HeLa cells. Total internalization, CME and NCE are shown, determined as explained in Supplementary data. (C) EGF dose–response curves of EGFR-NCE and EGFR ubiquitination (measured by ELISA, forward approach) in NR6 cells stably expressing EGFR-WT or the indicated add-back mutants. Symbols and error bars are not shown to avoid overcrowding of the figure; actual data are from Figures 8C (for EGFR-Ub) and Figure 9E (for EGFR-NCE). (D) Dose–response curves of 125I-EGF internalization in NR6 cells expressing EGFR-WT or the indicated add-back mutants. Total internalization, CME and NCE are shown, determined as explained in Supplementary Experimental Procedures.

