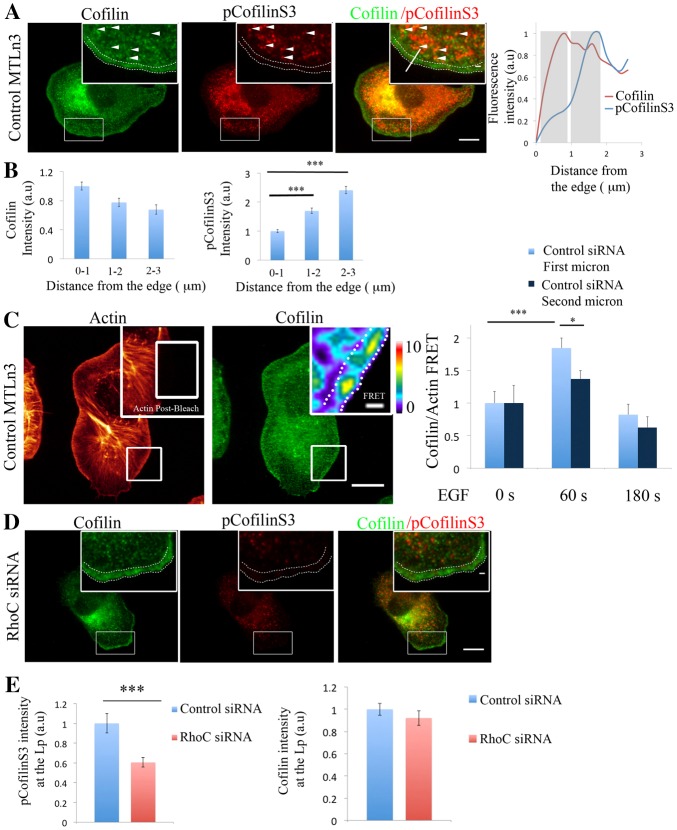
Fig. 3.
RhoC regulates pCofilinS3 levels in areas behind the leading edge during cell protrusion. (A) Representative images of MTLn3 cells stained for cofilin and pCofilinS3 showing cofilin and pCofilinS3 distribution at EGF-stimulated protrusions. Dotted double lines in all panels delineate the leading edge. White arrowheads indicate areas of colocalization between cofilin and pCofilinS3. Inserts in this and other figures show higher magnifications of the boxed regions. pCofilinS3 and cofilin intensity profiles along the indicated line in the overlay insert image are shown on the right. Grey rectangles highlight the first and the second micrometer behind the cell edge. (B) Quantification of cofilin and pCofilinS3 fluorescence intensity at adjacent regions of 1 µm width and 10 µm length at different distances from the edge, starting at the edge of the cell. Number of cells analyzed = 26 cells. P-values obtained by comparison with the control siRNA value. (C) Representative images of EGF-stimulated MTLn3 cells, fixed and labeled for cofilin (donor; Alexa Fluor 488) and F-actin (acceptor; Rhodamine). Using a high laser power, a region was bleached in the acceptor fluorescence channel (white box in the insert of the actin image). Insert: FRET efficiency image of the bleached area. Right panel: FRET efficiency was calculated in an area of 1 µm depth right at the edge of the cell or 1–2 µm behind the edge, in MTLn3 cells unstimulated and stimulated with EGF for 1 or 3 minutes (n>20 bleach regions per condition from different cells). FRET efficiency is normalized to control time = 0 s. Pseudocolor scale value represent FRET efficiency values. (D) Representative images of RhoC-siRNA-treated MTLn3 cells stained for cofilin and pCofilinS3. (E) Quantification of cofilin and pCofilinS3 fluorescence intensity at the lamellipodium [region of 3 µm from the cell edge to the cell interior (Chan et al., 2000; DesMarais et al., 2002)] in control- and RhoC-siRNA-treated MTLn3 cells stimulated with EGF. Values are normalized to control siRNA. Number of cells analyzed: control siRNA = 26, RhoC siRNA = 26. P-values obtained by comparison with the control siRNA value. Scale bars: 10 µm (main image); 1 µm (insert). *P<0.05, **P<0.01, ***P<0.001. Error bars indicate the s.e.m.

