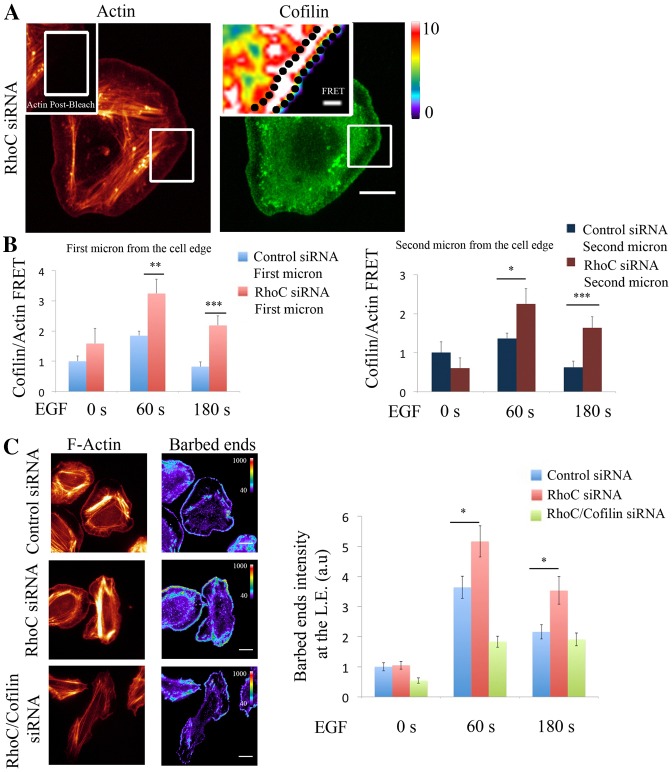
Fig. 4.
RhoC spatially confines cofilin/actin interaction to regulate cofilin-dependent barbed ends formation during leading edge protrusion. (A) Representative images of EGF-stimulated RhoC-siRNA-treated MTLn3 cells, fixed and labeled for cofilin (donor; Alexa Fluor 488) and F-actin (acceptor; Rhodamine). Insert: FRET efficiency image corresponds to the bleach area. (B) Graphs of FRET efficiency measurements calculated in: an area of 1 µm width right at the edge (left graph) or in an area 1 µm in width and 1 µm behind the cell edge (right graph), for control- and RhoC-siRNA-treated MTLn3 cells unstimulated, and stimulated with EGF for 1 or 3 minutes at each bleached region. n>10 bleach regions per condition from different cells. FRET efficiency is normalized to control time (0 seconds). Pseudocolor scale value represents FRET efficiency values. (C) Representative images of F-actin and barbed ends staining in: control-, RhoC- and RhoC/cofilin-siRNA-treated MTLn3 cells stimulated with EGF for 1 minute. Quantification of barbed end intensity in response to EGF at lamellipodia in control siRNA-treated MTLn3cells, RhoC-siRNA-treated MTLn3cells and RhoC/cofilin-siRNA-treated cells; n = 3 independent experiments with more than 20 cells per group. Scale bars: 10 µm (main images); 1 µm (inserts). P-values obtained by comparison with the control siRNA value; *P<0.05, **P<0.01, ***P<0.001. Error bars indicate the s.e.m.

