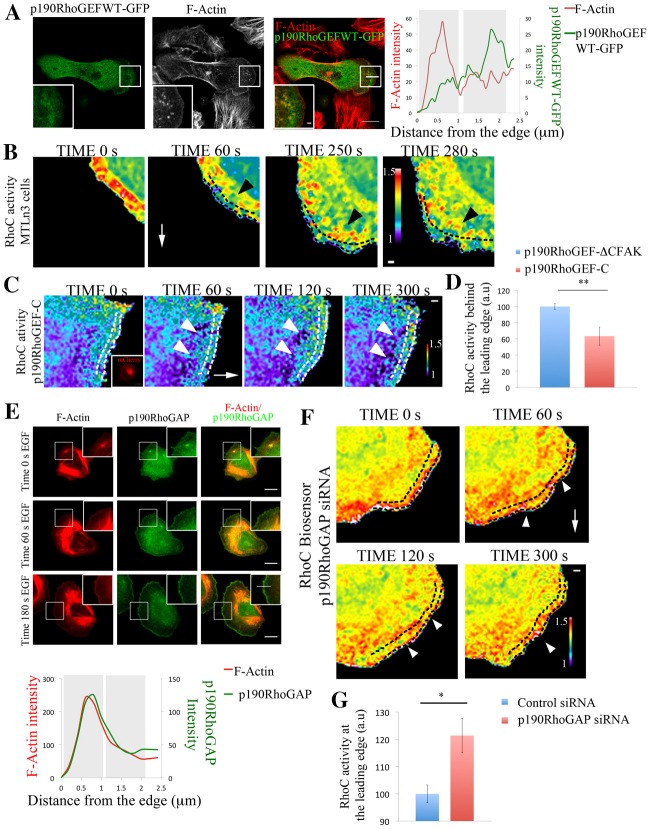
Fig. 5.
p190RhoGEF and p190RhoGAP regulate RhoC activity in areas behind the leading edge. (A) Representative images of MTLn3 cells expressing p190RhoGEFWT–GFP stimulated with EGF for 1 minute and stained for F-actin. Right panel: p190RhoGEFWT–GFP and F-actin intensity profiles along the indicated line in overlay image are shown. (B) Still images from a time-lapse movie of MTLn3 cells expressing RhoC biosensor after EGF stimulation. Dashed black lines delineate an area ∼1 µm depth from the cell edge. Black arrowheads point to areas of high RhoC activation behind the leading edge. White arrows point in the direction of the protrusion. Time points are the time after EGF was added. (C) Still images from a time-lapse movie of a MTLn3 cell expressing RhoC biosensor and p190RhoGEF-C–mCherry (inactive mutant; see Materials and Methods for detailed description) after EGF stimulation. Insert in the time 0 s panel shows the fluorescence intensity of p190RhoGEF-C–mCherry. The white arrow points in the direction of the protrusion. White arrowheads point to areas of fluorescence 1 µm behind the cell edge. Dashed white lines represent an area of approximately 1 µm depth from the cell edge. Time points are the times after EGF was added. (D) Quantification of RhoC activity in an area of 1 µm width and 10 µm length, 1 µm behind the cell edge in cells expressing p190RhoGEF-CΔFAK–mCherry (control; see Materials and Methods for detailed description) and p190RhoGEF-C–mCherry (inactive mutant) and stimulated with EGF for 1 minute. Number of cells analyzed: control (p190RhoGEF-ΔCFAK) = 11, p190RhoGEF-C = 11. P-values obtained by comparison with the control siRNA value. Values are normalized to p190RhoGEF-CΔFAK (control). (E) Representative images of MTLn3 cells stained for F-actin and p190RhoGAP at different times after EGF stimulation. Bottom panel: p190RhoGAP and actin intensity profiles along the line shown in the 180 s EGF overlay insert image. (F) Still images from a time-lapse movie of a p190RhoGAP-siRNA-treated MTLn3 cell expressing RhoC biosensor, after EGF stimulation. Time points are the time after EGF was added. The white arrow points in the direction of the protrusion. White arrowheads point to areas at the leading edge showing high RhoC activation. Dashed black lines delineate an area of ∼1 µm depth from the cell edge. (G) Quantification of RhoC activity in an area of 1 µm width and 10 µm length, starting at the cell edge in control- and p190RhoGAP-siRNA-treated MTLn3 cells stimulated with EGF for 1 minute. P-values obtained by comparison with the control siRNA value. Number of cells analyzed: control siRNA = 12, p190RhoGAP siRNA = 24. The pseudocolor scale here shows ratio limits of black to red for RhoC activity. Scale bars: 10 µm (main images); 1 µm (inserts). *P<0.05, **P<0.01. Error bars indicate the s.e.m.

