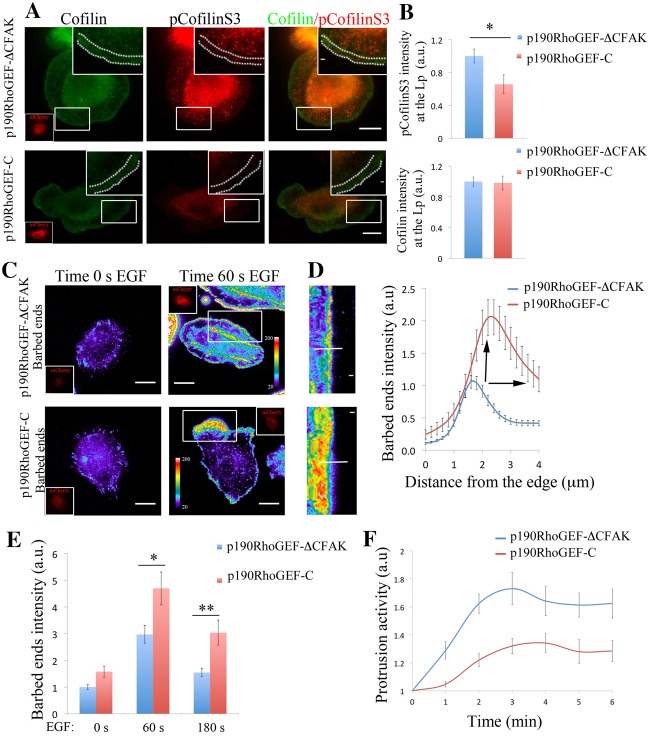
Fig. 6.
p190RhoGEF regulates pCofilinS3 levels, barbed ends amplitude and protrusion formation. (A) Representative images of MTLn3 cells expressing p190RhoGEF-CΔFAK–mCherry (control) and p190RhoGEF-C–mCherry (inactive mutant) stained for cofilin and pCofilinS3 showing cofilin and pCofilinS3 distribution at EGF-stimulated protrusions. Dotted lines in the enlarged image delineate the leading edge. Inserts in cofilin panels show the mCherry fluorescence intensity of p190RhoGEF-CΔFAK–mCherry or p190RhoGEF-C–mCherry. (B) Quantification of cofilin and pCofilinS3 fluorescence intensity at the lamellipodium of MTLn3 cells expressing p190RhoGEF-CΔFAK–mCherry (control) and p190RhoGEF-C–mCherry, and stimulated with EGF. Values are normalized to p190RhoGEF-ΔC–mCherry. Number of cells analyzed: p190RhoGEF-CΔFAK–mCherry = 24, p190RhoGEF-C–mCherry = 11. P-values obtained by comparison with the p190RhoGEF-CΔFAK–mCherry value. (C) Representative images of barbed ends staining after 1 minute EGF stimulation, in MTLn3 cells expressing p190RhoGEF-CΔFAK–mCherry (control) and p190RhoGEF-C–mCherry. (D) Radial sweep of white boxes in panel C. A white line is used to generate the quantification depicted in the right panel. Right panel: fluorescence intensity of barbed end measured from the cell edge (0 µm) into the cell (4 µm) through a region 5 µm wide, in p190RhoGEF-CΔFAK–mCherry (control) and p190RhoGEF-C–mCherry MTLn3 cells. Values are the means of 34 cells (with three regions per cell) in p190RhoGEF-CΔFAK (control) and 30 cells (with three regions per cell) in p190RhoGEF-C–mCherry. Black arrows point to the increase in p190RhoGEF-C–mCherry barbed end amplitude compared with that of the control. (E) Quantification of barbed end intensity in response to EGF at lamellipodia in p190RhoGEF-CΔFAK (control) and p190RhoGEF-C–mCherry MTLn3 cells. n = 3 independent experiments with ∼45 cells per group. (F) Quantification of protrusive activity in response to EGF in MTLn3 cells expressing p190RhoGEF-CΔFAK–mCherry (control) and p190RhoGEF-C–mCherry. Membrane protrusion is standardized to time 0. Number of cells analyzed: p190RhoGEF-CΔFAK–mCherry (control) = 7, p190RhoGEF-C–mCherry = 9. Scale bars: 10 µm (main images); 1 µm (inserts). Pseudocolor scale bar shows the barbed end intensity. *P<0.05, **P<0.01. Error bars indicate the s.e.m.

