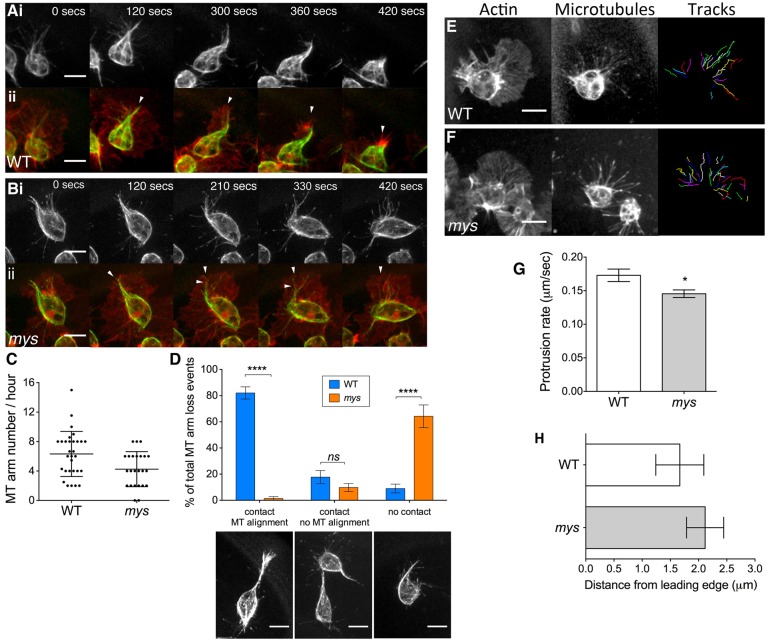
Fig. 5.
myospheroid is important in maintaining haemocyte microtubule dynamics. (A–F) Stills taken from live-cell imaging of haemocytes expressing Clip170–GFP, to label microtubules (MTs), and mCherry–Moesin, to label F-actin, migrating randomly at stage 15. The imaging reveals disruption of MT dynamics in haemocytes lacking functional myospheroid. (A) In WT haemocytes, loss of the MT arm coincides with repolarisation of the actin cytoskeleton. (B) In mys mutant haemocytes the MT arm often collapses within the actin protrusions. (C) Quantification of the number of MT arms formed in a haemocyte per hour reveals no significant difference between WT and mys mutant haemocytes. Values are means ± s.e.m. for n = 30 (WT) and n = 24 (mys) haemocytes. (D) Quantification of the interactions triggering MT arm loss upon cell–cell contact with MT arm alignment or with no MT arm alignment, or MT arm loss independent of cell-cell contact, in WT and mys haemocytes. Values are means ± s.e.m. for n = 30 (WT) and n = 24 (mys) total MT arm loss events. (E,F) Stills taken from rapid live-cell imaging of haemocytes expressing mCherry–Clip and Moesin–GFP under the control of a single copy of the srp-GAL4 driver to label only the MT + ends. (G) Tracking the MT tips revealed that in the absence of myospheroid, the MT protrusion rate was decreased (WT and mys protrusion rates were 0.17 and 0.15 µm/second, respectively, P<0.05. Values are means ± s.e.m. for n = 9 haemocytes for each genotype. (H) The distance to the leading edge reached by the MT tips in mys mutant haemocytes was not significantly different from that in WT (mean distance was 2.1 µm and 1.7 µm, respectively). Values are means ± s.e.m. for n = 9 haemocytes per genotype. Scale bars: 10 µm (A, B), 10 µm (E, F), 10 µm (D).

