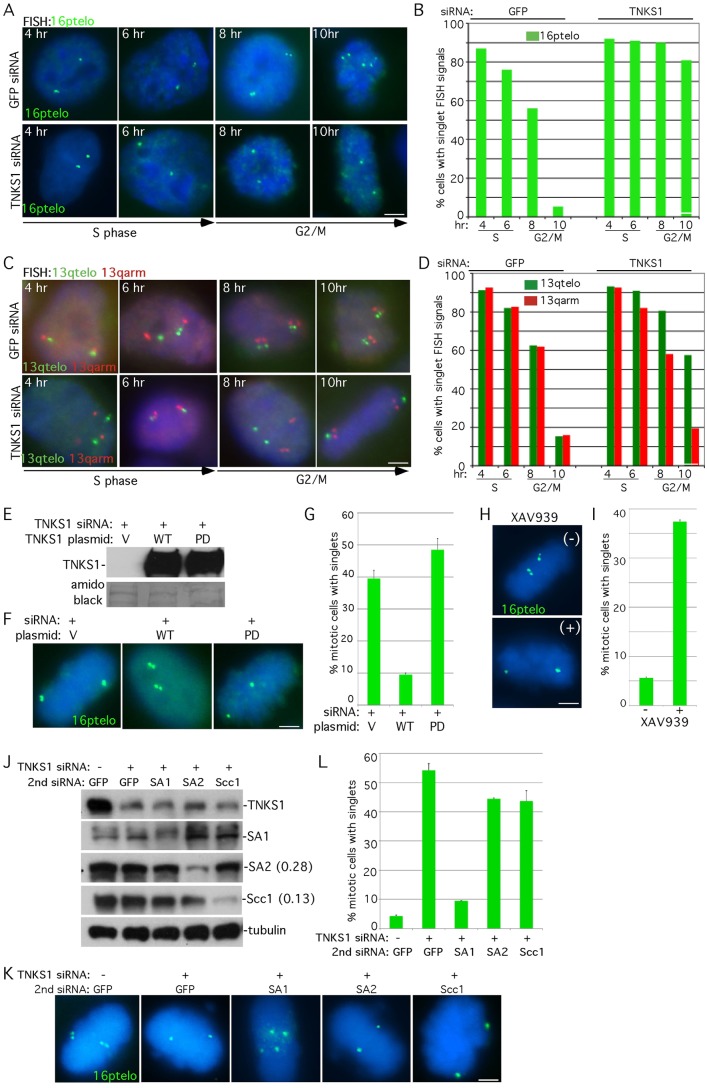
Fig. 1.
Resolution of telomere cohesion occurs in G2/M and is dependent on PARP-active tankyrase 1. (A–D) Cell cycle analysis of cohesion. HeLa.I.2.11 cells were synchronized by a double thymidine block, treated with control (GFP) or TNKS1 siRNA, released at 4, 6, 8 and 10 hours, and analyzed by FISH with (A) a 16ptelo (green) or (C) a 13qtelo (green) and 13qarm (red) probe. (B,D) Graphical representation of the frequency of cells with singlet FISH signals from (A; n = 250 cells or more each) and (C; n = 150 cells each), respectively. (E–I) Resolution of sister telomere cohesion requires the PARP activity of tankyrase 1. (E–G) Supertelomerase HeLa cells were synchronized by a double thymidine block, co-transfected with tankyrase 1 siRNA and a control vector (V) or a plasmid containing tankyrase 1 wild type (WT) or PARP-Dead (PD), released for 10 hours, isolated by mitotic shake-off, and analyzed by (E) immunoblot or by (F) FISH with a 16ptelo probe. (G) Graphical representation of the frequency of mitotic cells with singlet FISH signals derived from two independent experiments. Values are means ± s.e.m. (n = 20 cells or more each). (H,I) HeLa1.2.11 cells were synchronized by a double thymidine block, released for 10 hours in the absence (−) or presence (+) of the tankyrase PARP inhibitor XAV939 (1 µm), isolated by mitotic shake-off and analyzed by (H) FISH with a 16ptelo probe. (I) Graphical representation of the frequency of mitotic cells with singlet FISH signals. Values are means ± s.d. from three independent experiments (n = 99 cells or more each). (J–L) Tankyrase 1-induced persistent telomere cohesion is rescued by depletion of SA1, but not by depletion of SA2 or the cohesin ring. HeLaI.2.11 cells were transfected without (−) or with (+) TNKS1 siRNA along with a second siRNA against GFP, SA1, SA2 or Scc1 for 48 hours and analyzed by (J) immunoblot (protein levels relative to α-tubulin and normalized to the GFP siRNA control are indicated next to the blots) or isolated by mitotic shake-off, and analyzed by (K) FISH using a 16ptelo probe (green). (L) Graphical representation of the frequency of mitotic cells with unseparated telomeres in mitosis. Values are means ± s.e.m. from two independent experiments (n = 120 cells or more each). In A, C, F, H, and K DNA was stained with DAPI (blue). Scale bars: 5 µm.

