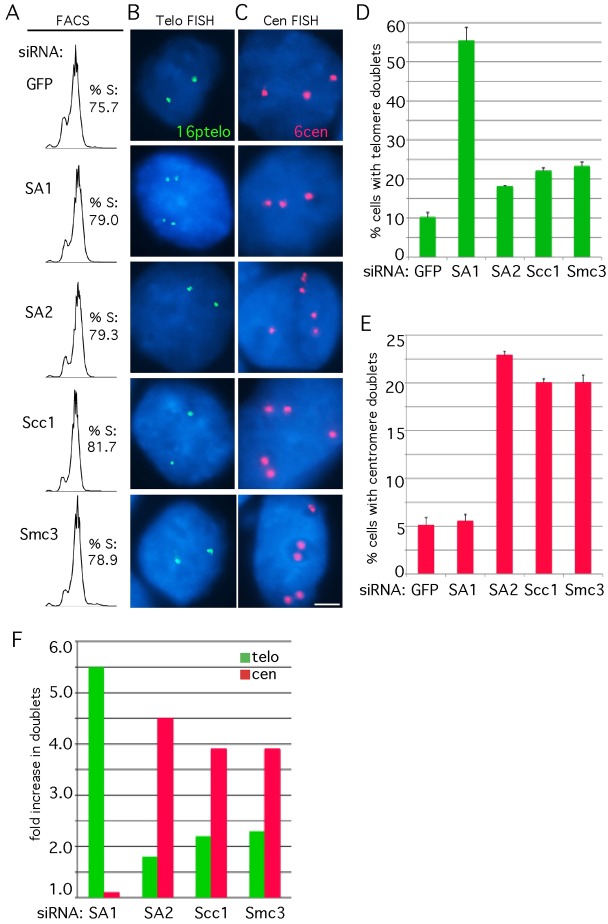
Fig. 3.
Telomere cohesion is established in S phase in cohesin-ring-depleted cells. HeLa.I.2.11 cells were synchronized by a double thymidine block, treated with siRNA against GFP, SA1, SA2, Scc1 or Smc3 and analyzed by (A) FACS, (B) telomere FISH with a telomere 16ptelo (green), or (C) centromere FISH with a 6cen (red) probe 4 hours after release from the second thymidine block. DNA was stained with DAPI (blue). Scale bar: 5 µm. (D,E) Graphical representation of the frequency of telomere (from B; n = 514 cells or more each) and centromere (from C; n = 441 cells or more each) doublets in S phase, respectively. Values are means ± s.e.m., derived from two independent experiments. (F) Graphical representation of the fold increase in telomere (from D) and centromere (from E) doublets relative to the GFP siRNA control.

