Fig. 5.
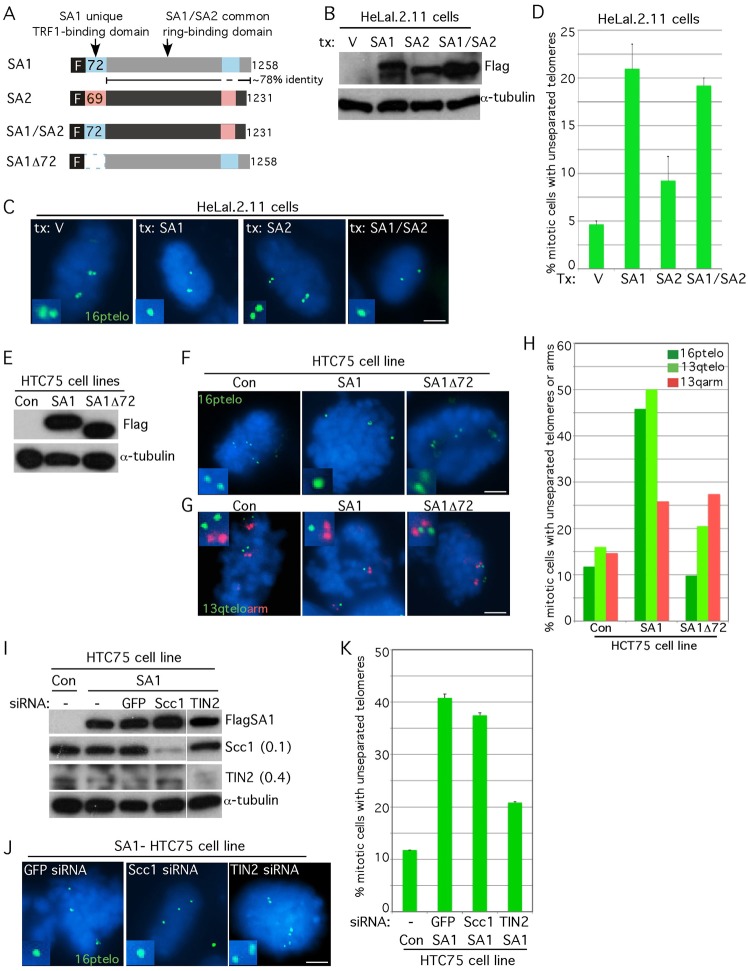
SA1 induces persistent sister chromatid cohesion at telomeres. (A) Schematic representation of FLAG-tagged SA1, SA2 and mutant alleles SA1/SA2 and SA1Δ72. (B–D) Overexpression of SA1 but not SA2, induced persistent telomere cohesion. HeLaI.2.11 cells were transfected with vector, SA1, SA2 or SA1/SA2 for 20 hours and analyzed by (B) immunoblot and (C) telomere FISH using a 16ptelo probe (green) following mitotic shake-off. (D) Graphical representation of the frequency of mitotic cells with unseparated telomeres. Values are means ± s.e.m., derived from two independent experiments (n = 68 cells or more each). (E–H) SA1 induced persistent cohesion specifically at telomeres, dependent on its N-terminal domain. Stable HTC75 cell lines overexpressing SA1 or SA1Δ72 or control cells (Con) were analyzed by (E) immunoblot, (F) telomere FISH using a 16ptelo probe or (G) by double FISH with a 13qtelo (green) and 13qarm (red) probe following mitotic shake-off. (H) Graphical representation of the frequency of mitotic cells with unseparated telomeres or arms (n = 102 cells or more each). (I–K) SA1 induced persistent telomere cohesion independent of Scc1, but dependent on TIN2. Stable SA1-HTC75 or control cells were treated without (−) or with siRNA against GFP, Scc1 or TIN2 and analyzed by (I) immunoblot (protein levels relative to α-tubulin and normalized to the GFP siRNA control are indicated next to the blots) and (J) telomere FISH using a 16ptelo probe (green) following mitotic shake-off. (K) Graphical representation of the frequency of mitotic cells with unseparated telomeres. Values are means ± s.e.m., derived from two independent experiments (n = 29 cells or more each). In C, F, G and J DNA was stained with DAPI (blue). Scale bars: 5 µm.

