Figure 1.
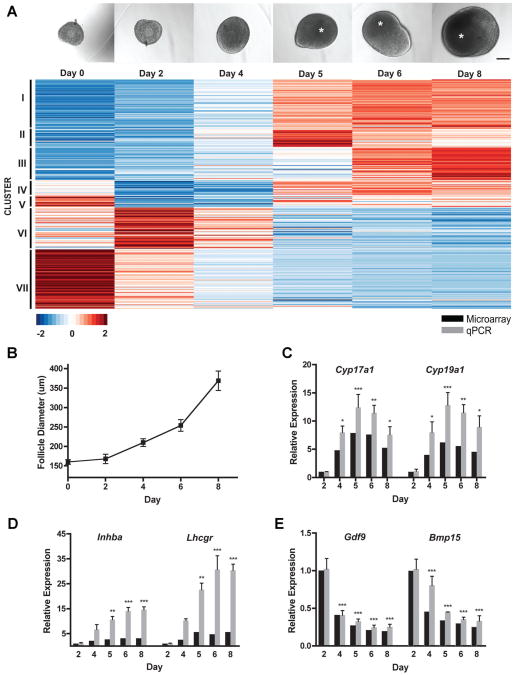
Microarray analysis of in vitro-grown follicles. A: Representative gross morphology of an individual follicle encapsulated in alginate at 0, 2, 4, 5, 6, and 8 days in vitro. Asterisks denote antral cavities. Scale bar, 100 μm. Heat-map representation of results from genome-wide expression analysis of in vitro-grown follicles. K-means clustering of the scaled average intensity of the significant genes indicated seven clusters. B: Average follicle diameters from days 0 to 8 (n = 423 individual follicles). Data are expressed as mean ± standard error mean. C–E: Microarray validation. Microarray and qPCR results of Cyp17a1, Cyp19a1 (C), Inhba, Lhcgr (D), Gdf9, and Bmp15 (E) expression in cultured follicles compared to expression on day 2. For microarray P ≤ 0.01, n = 2–3. For qPCR, n = 3; *P < 0.05, **P < 0.01, ***P< 0.001, according to one-way ANOVA followed by Bonferroni's Multiple Comparison Test.

