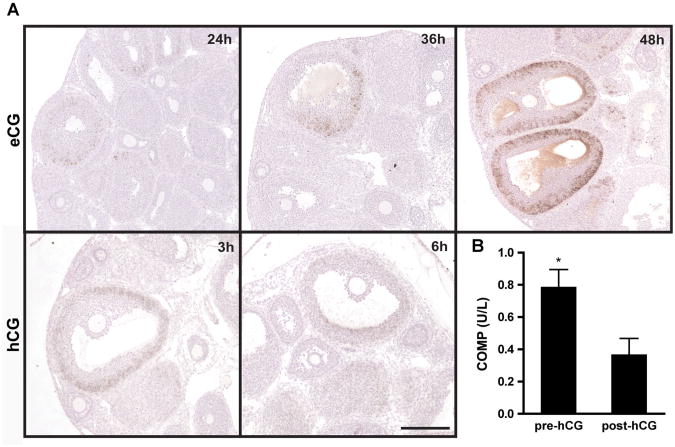
Figure 4.
Gonadotropin regulation of COMP. A: Histological ovarian sections stained for COMP from prepubertal mice treated with 5IU eCG 12, 24, and 36hr post-injection (upper panel). Mice were injected with hCG 48hrpost-eCG, and slides were stained for COMP 3 and 6hr post-hCG injection (lower panel). Scale bar, 200 μm. Images are representative of three independent experiments. B: ELISA results for COMP in culture medium from primary granulosa cells before and after 1.5 IU hCG treatment *P < 0.05 (n=3 independent experiments).

