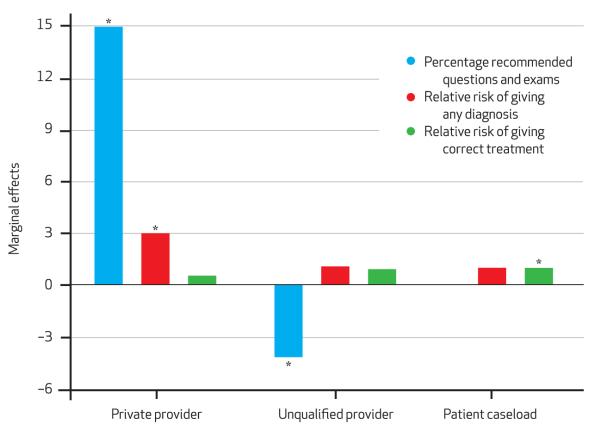
Exhibit 5. Marginal Effects On Process Quality, Diagnosis, And Treatment Of Provider And Clinic Characteristics In Delhi.
source Authors’ analysis. notes This figure graphs the regression coefficients of three separate regressions of provider and clinic characteristics (an indicator for working in the private sector, an indicator for having no medical qualifications, and the patient caseload at the time of the standardized patients’ visits) on the percentage of recommended questions asked and exams performed, the relative risk of giving any diagnosis, and the relative risk of giving a correct treatment. Thus, the effects in regression 1 are percentage points. The effects in regressions 2 and 3 are rates—for example, private providers are three times as likely as public providers to provide any diagnosis. Bars labeled with an asterisk denote statistical significance at least at the 90 percent level of confidence. The other coefficients cannot be significantly distinguished from 0 (for regression 1) or from 1 (for regressions 2 and 3). Each regression also contains indicator variables for each standardized patient and for the neighborhood’s being in the bottom 20 percent of a wealth distribution implied by an asset index we created from the average household’s ownership of seventeen assets, such as a television or a floor that is not made out of mud. *p < 0.10

