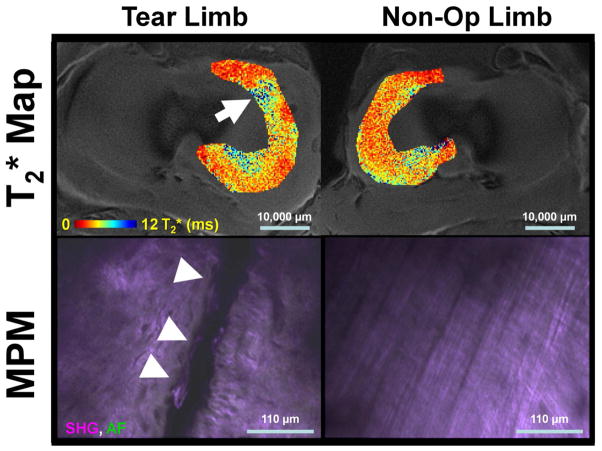
Figure 10.
Representative axial medial meniscal T2* maps and corresponding fused second harmonic generation (SHG) and autofluorescence (AF) multiphoton microscopy (MPM) image data. Tear limbs had heterogeneous T2* maps (arrow) and frank tears on MPM (arrow heads). Non-Op limbs had T2* maps of lower magnitude and an overall ordered collagen structure in the MPM images. Scale bars are given for the T2* maps and MPM images.

