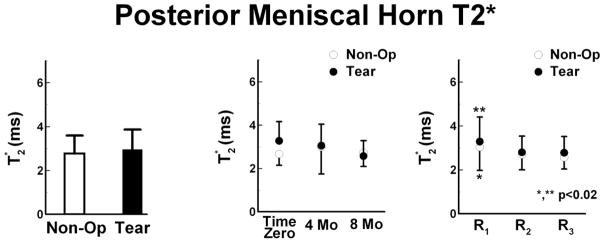
Figure 4.

Posterior meniscal horn T2* values (mean ± SD) of the Non-Op and Tear limbs. Left – Tear limbs had similar T2* values as compared to Non-Op limbs. Center – T2* values of Tear limbs reduced over time, from Time Zero to 4 months to 8 months. For the Non-Op limb, the average T2* value at 4 Mo tended to be prolonged when compared to Time Zero and 8 Mo. Right - The peripheral region (R1) of Tear and Non-Op limbs had prolonged T2* values as compared to the central (R2) and internal (R3) regions.
