
Figure 5.
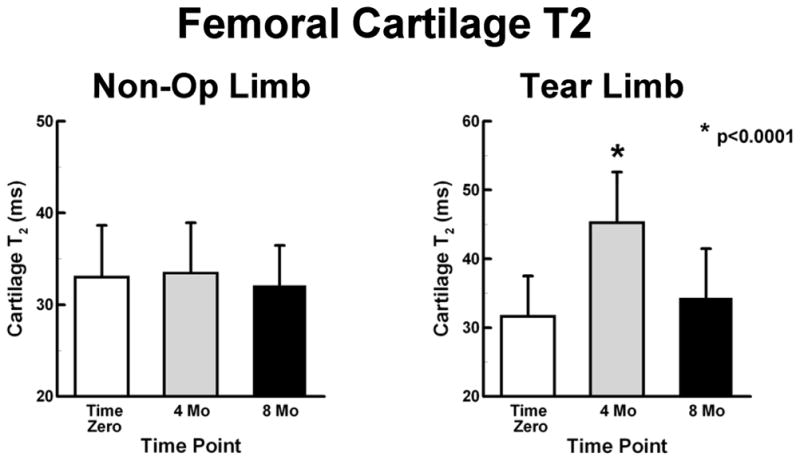
Femoral cartilage T2 values (mean ± SD) of the Non-Op and Tear limbs. Left - Non-Op limbs maintained T2 values at the different time points during the study. Right - Tear limbs had elevated T2 values at 4 months.
Official websites use .gov
A
.gov website belongs to an official
government organization in the United States.
Secure .gov websites use HTTPS
A lock (
) or https:// means you've safely
connected to the .gov website. Share sensitive
information only on official, secure websites.
Femoral cartilage T2 values (mean ± SD) of the Non-Op and Tear limbs. Left - Non-Op limbs maintained T2 values at the different time points during the study. Right - Tear limbs had elevated T2 values at 4 months.