
Figure 8.
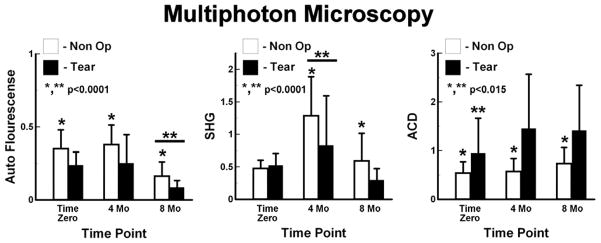
Quantitative multiphoton microscopy. Left – Autoflourescence was larger in Non-Op limbs than Tear Limbs, and was lowest at 8 Mo. Center – Second Harmonic Generation (SHG) was higher in Non-Op limbs than Tear limbs. The largest SHG was at 4 Mo. Right - Auto-Correlation (ACD) higher for Tear limbs than for Non-Op limbs. Tear limbs had the lowest ACD at Time Zero.