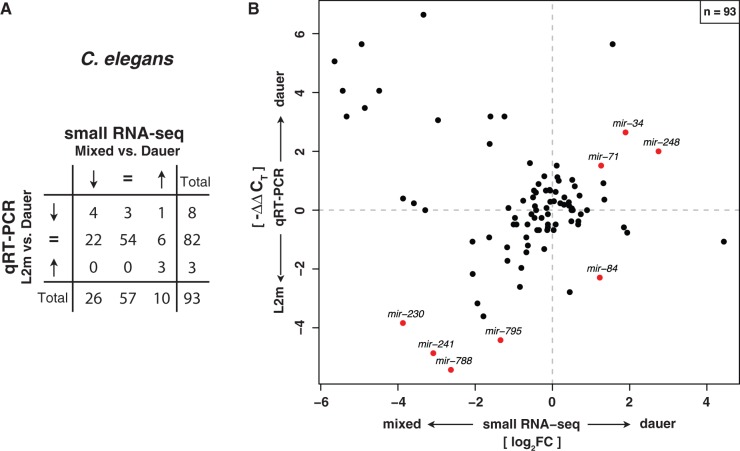
Fig. 3.—
Small RNA-seq expression profiles in Caenorhabditis elegans agree with qRT-PCR data. (A) Contingency table of expression fold changes of C. elegans dauer versus mixed stage obtained by Illumina small RNA deep sequencing compared with qRT-PCR data of dauer versus L2m from Karp et al. (2011) classified according to three categories (upregulated, downregulated, and unaffected). Expression fold changes of both data sets are significantly correlated (P = 1.1 × 10⁻⁵, χ2 test). (B) Quantitative comparison of expression fold changes obtained by small RNA-seq and qRT-PCR experiments in C. elegans. Names of all miRNAs with a significant expression change of at least 2-fold in both experiments are displayed. Significance of differential miRNA levels in small RNA-seq data between mixed stage and dauer/iL3 was determined by a two-sided binomial test constrained on the total library sizes followed by correction for multiple testing (FDR < 0.05).

