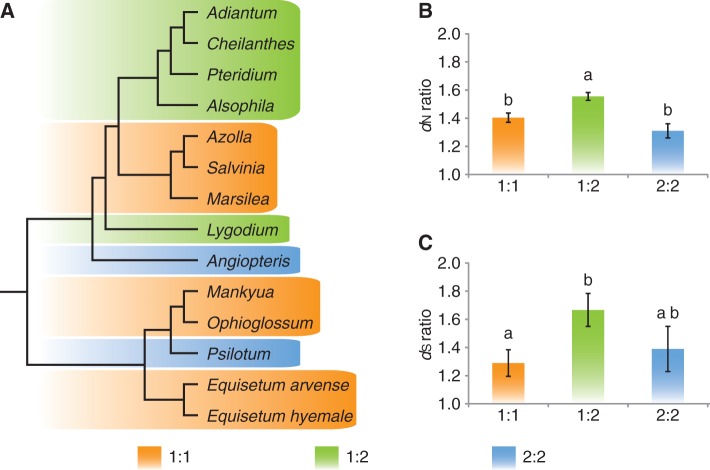
Fig. 2.—
The copy number variance of the two exons of ndhB gene in ferns and its impact on evolutionary rate. 1:1, one copy exon 1 plus one copy exon 2; 1:2, one copy of exon 1 plus two copies of exon 2; and 2:2, two copies of exon 1 plus two copies of exon 2. (A) The distribution of copy status of different ndhB exons among ferns. (B) The ratio of nonsynonymous (dN) substitution rates between exon 1 and exon 2. (C) The ratio of synonymous (dS) substitution rates between exon 1 and exon 2. (B) and (C), means labeled with different letters are significantly different (Tukey HSD test, P < 0.05).

