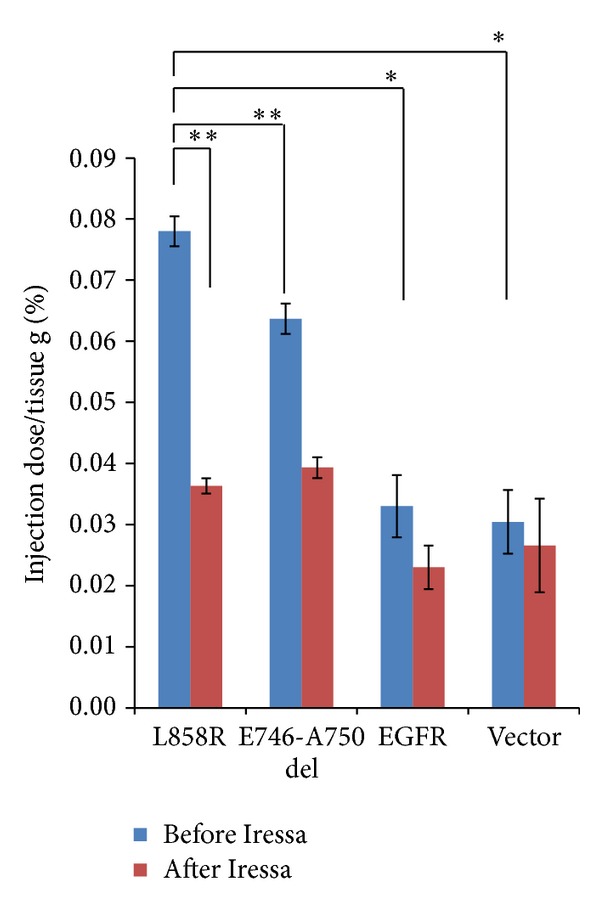
Figure 5.

Quantification of accumulation of [124I]IPQA in different tumor xenografts at baseline (blue) and pretreated with Iressa (red), respectively. Error bars represent standard deviation; statically significant difference is indicated by an asterisk (*P < 0.05) or double asterisks (**P < 0.01).
