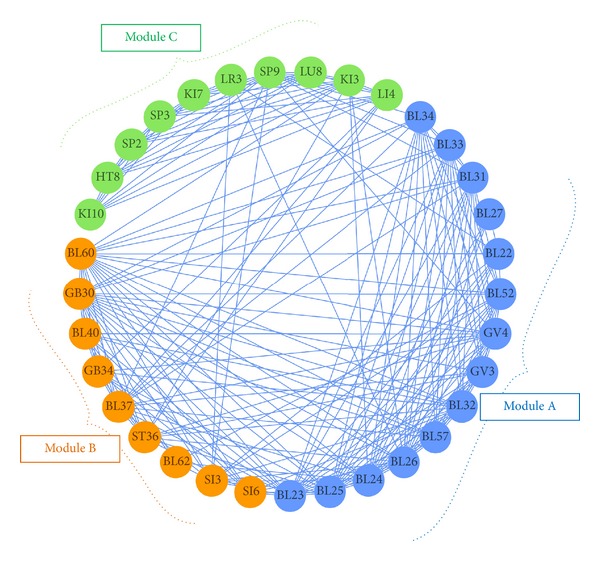
Figure 2.

The network model based on module analysis, showing the grouped acupoints. Three modules were identified and are shown in this circular form: Module A (blue nodes), acupoints BL23, BL25, BL24, BL26, BL57, BL32, GV3, GV4, BL52, BL22, BL27, BL31, BL33, and BL34; Module B (orange nodes), acupoints BL60, GB30, BL40, GB34, BL37, ST36, BL62, SI3, and SI6; and Module C (green nodes), acupoints LI4, KI3, LU8, SP9, LR3, KI7, SP3, SP2, HT8, and KI10.
