
Figure 2.
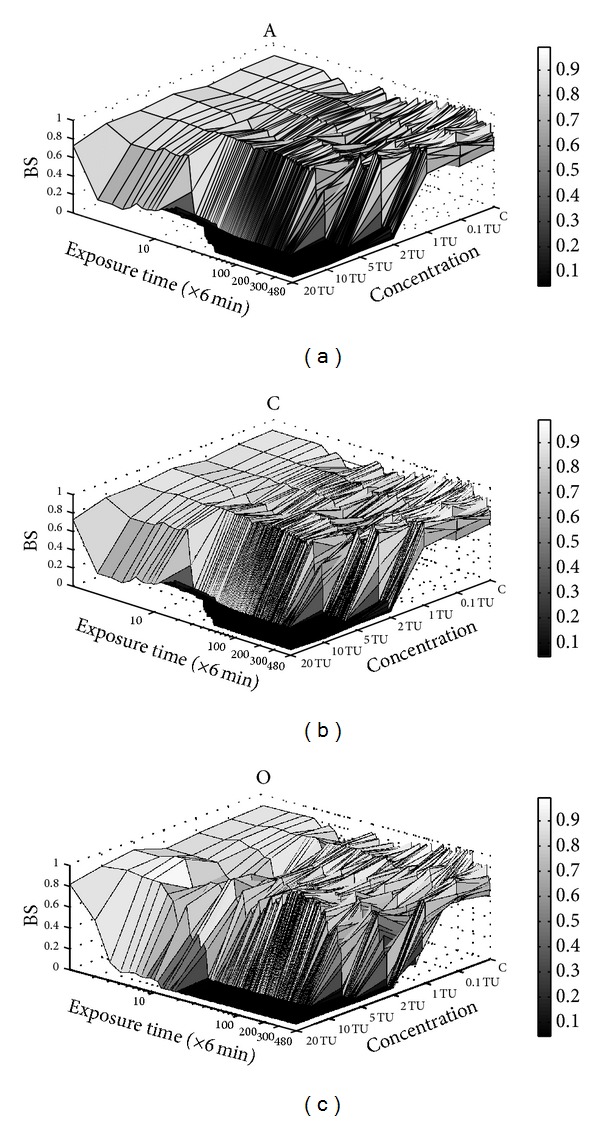
The effects of different treatments on the behavioral responses of the rare minnow at different times. Exposure time is shown on a logarithmic scale. The BS values were used in a statistical analysis of the tendencies shown by the behavioral responses of the rare minnow to different CPs. A, C, and O indicate the individual effects of arprocarb, carbofuran, and oxamyl on the behavioral responses of the rare minnow.