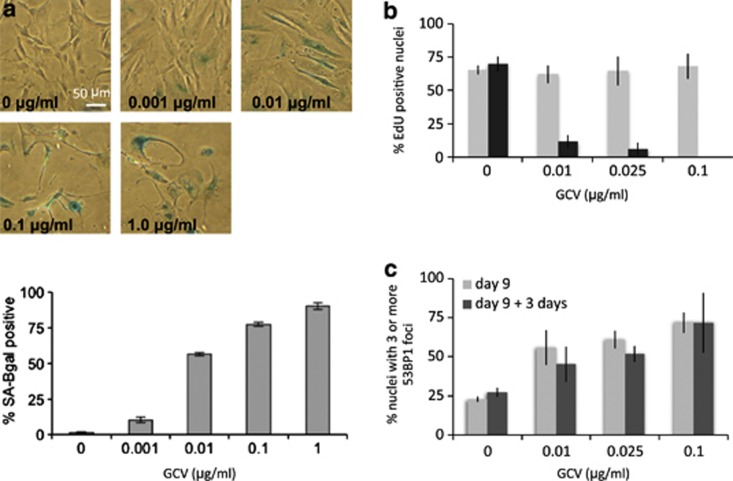
Figure 2.
GCV induces senescence through DNA damage accumulation. (a) Top panel: HCA2-3MR cells were given the indicated concentrations of GCV 48 h after plating; media+or −GCV were replenished every 2 days. Cells were fixed and SA-βGal staining (blue) was performed 10 days later. Lower panel: The fraction of SA-βGal-positive cells was quantified and plotted as the percentage of positive cells per GCV concentration. (b) EdU (5-ethynyl-2′-deoxyuridine) DNA labeling indexes were determined in cells treated with GCV. Light gray: HCA2-control cells; dark gray: HCA2-3MR cells. Cells were seeded on glass slides and given the indicated concentrations of GCV 48 h after plating for 7 days (media+or −GCV were replenished every 2 days). EdU was added from day 7 to day 8 (24 h pulse) and the percentage of EdU-positive cells was determined in at least 200 cells per GCV concentration. (c) Persistent DNA damage foci were determined in cells treated with GCV. Light gray: HCA2-3MR cells treated with GCV for 9 days; dark gray: HCA2-3MR cells treated similarly and chased for 3 days in GCV-free media. Cells on glass slides were given the indicated concentrations of GCV 48 h after plating for 9 or 12 days (media+or −GCV were replenished every 2 days). The percentage of cells with ≥3 persistent 53BP1 nuclear foci (DNA-SCARS) was determined as described in Figure 1d

