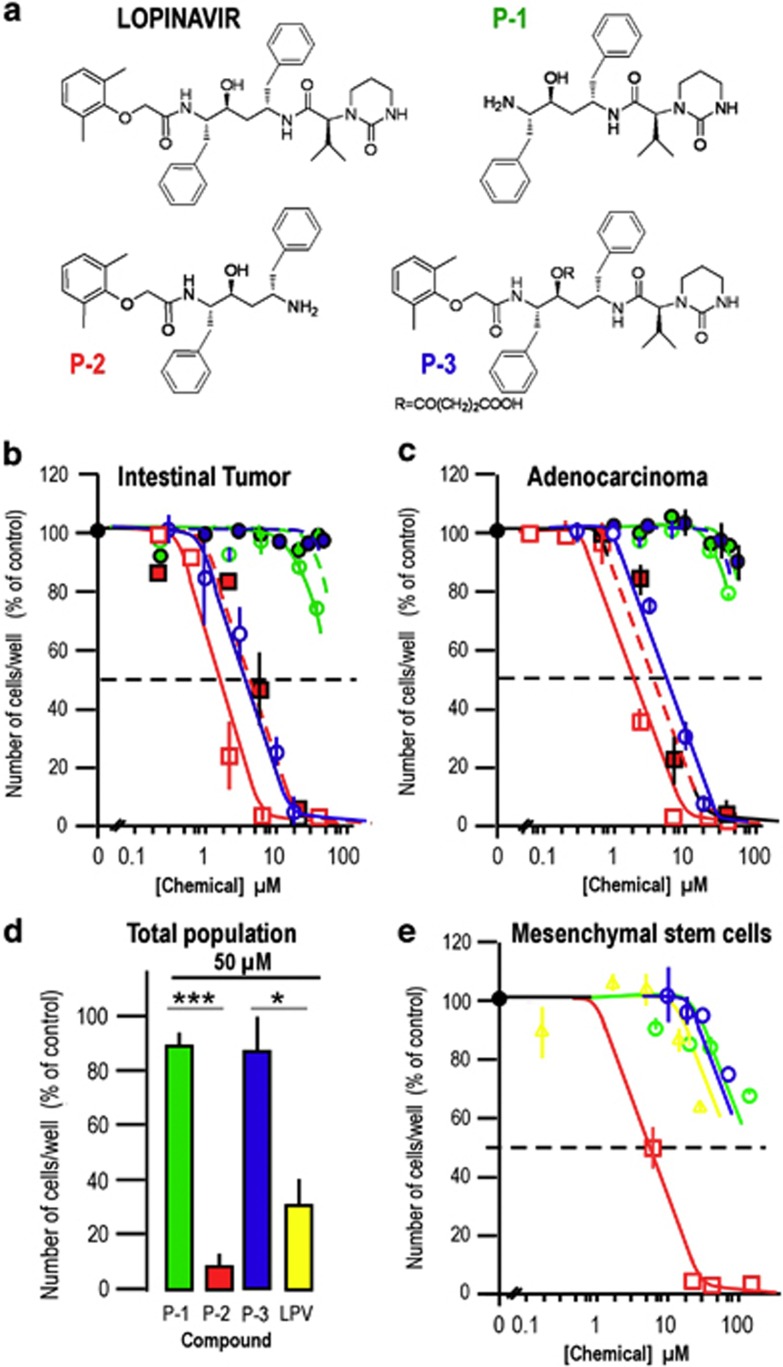
Figure 3.
Structure activity of LPV for its antitumoral properties. (a) Structures of LPV and pharmacophores. (b) Dose-response curves for pharmacophore P-1 (green circles), pharmacophore P-2 (red square) or pharmacophore P-3 (blue circle) -induced inhibition of cell proliferation for CSC (open symbols) or the total population (filled symbols and dashed curves) of an intestinal tumor. The results represent the mean±S.E.M. of three experiments carried out in duplicate. (c) Dose-response curves for pharmacophore P-1 (green circles), pharmacophore P-2 (red square) or pharmacophore P-3 (blue circle) -induced inhibition of cell proliferation for CSC (open symbols) or the total population (filled symbols and dashed curves) of an adenocarcinoma. The results represent the mean±S.E.M. of three experiments carried out in duplicate. (d) Comparison between the effects of LPV and pharmacophores P-1, P-2, P-3 on cell proliferation of the total population of an intestinal tumor. The results represent the mean±S.E.M. of three experiments carried out in duplicate (*P<0.05; ***P<0.001). (e) Dose-response curves for LPV (yellow symbol and curve), pharmacophore P-1 (green circle and curve), or pharmacophore P-2 (red square and curve), or pharmacophore P-3 (blue circle and curve) -induced inhibition of cell proliferation for human mesenchymal stem cells. The results represent the mean±S.E.M. of three experiments carried out in duplicate. For panels (b–e), error bars were omitted when the S.E.M. was smaller than the size of the symbol

