Figure 2.
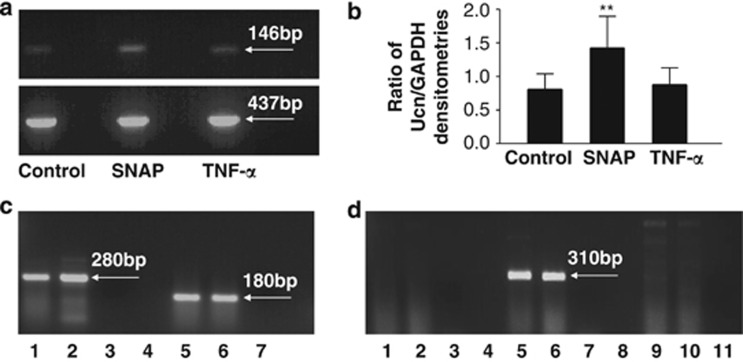
(a) RT-PCR analysis of Ucn (upper panel) and GAPDH (lower panel) expression in control (untreated) C-20/A4 chondrocytes and cells treated with 1 mM SNAP and 70 pg/ml TNF-α. Ucn and GAPDH amplicon sizes are indicated. (b) Ratio of Ucn/GAPDH expression in control (untreated) C-20/A4 chondrocytes and cells treated with 1 mM SNAP and 70 pg/ml TNF-α as determined by densitometric analysis of PCR products shown in a. (c) RT-PCR analysis of CRFR subtype expression in C-20/A4 chondrocytes. Lanes 1 and 2=CRFR1 product, lane 3=CRFR1-negative control, lanes 5 and 6=CRFR2 product, lane 7=CRFR2-negative control. CRFR amplicon sizes are indicated. (d) RT-PCR analysis of CRFR2 splice variant expression in C-20/A4 chondrocytes. Lanes 1 and 2=CRFR2α PCR – no product, lane 3=CRFR2α-negative control, lanes 5 and 6=CRFR2β PCR product, lane 7=CRFR2β-negative control, lanes 9 and 10=CRFR2γ PCR – no product, lane 11=CRFR2γ-negative control. CRFRβ amplicon size is indicated

