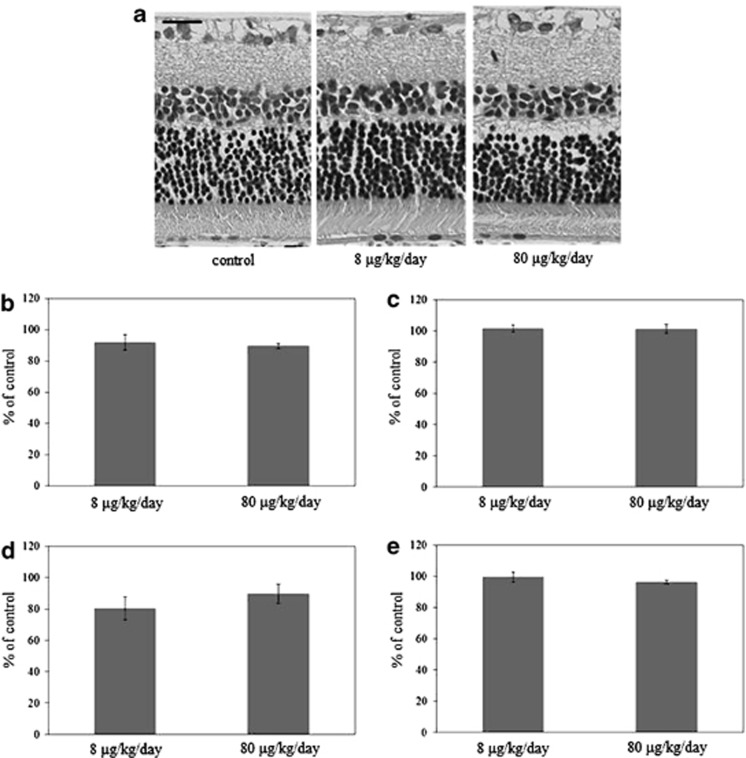
Figure 3.
Retinal thickness layer analysis. (a) Light micrographs of the retina of an eye treated with 8 μg/kg/day or 80 μg/kg/day aldosterone for 6 weeks, and a normal control eye. Change in mean thickness of the (b) inner plexiform layer (IPL), (c) inner nuclear layer (INL), (d) outer plexiform layer (OPL), and (e) outer nuclear layer (ONL). Results are expressed as the mean±S.E.M. (n=4 in each group). Scale bar, 20 μm

