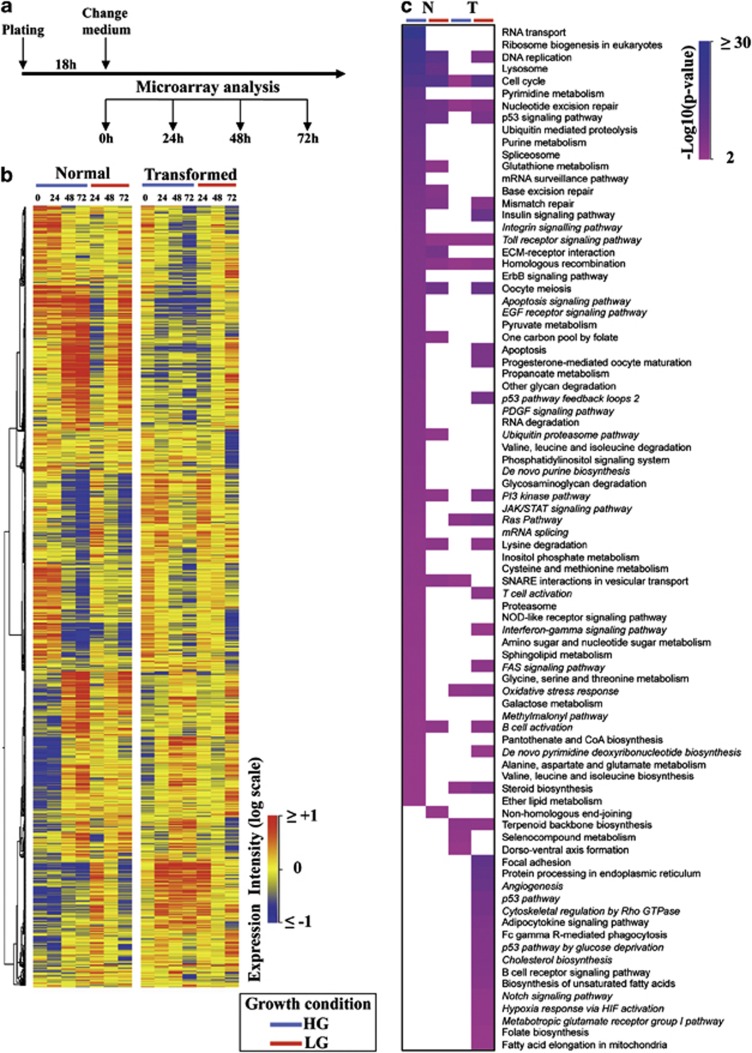
Figure 1.
Genes and pathways regulated in normal and transformed cells grown in HG and LG. (a) Schematic representation of the experimental procedure used to identify regulated genes in both cell lines grown along a time course of 72 h and in two glucose concentrations. (b) Starting from 5295 genes identified by Welch's ANOVA and PCA, a hierarchal clustering was performed. Expression levels are depicted by a color log scale from red (high expression) to blue (low expression). Each row indicates the expression value of a transcript in a specific condition (columns). (c) Pathway enrichment analysis, according to their P-values, of the differentially expressed genes achieved at 72 h in both cell lines grown in HG and LG. The pathways have been ranked according to normal cells grown in HG

