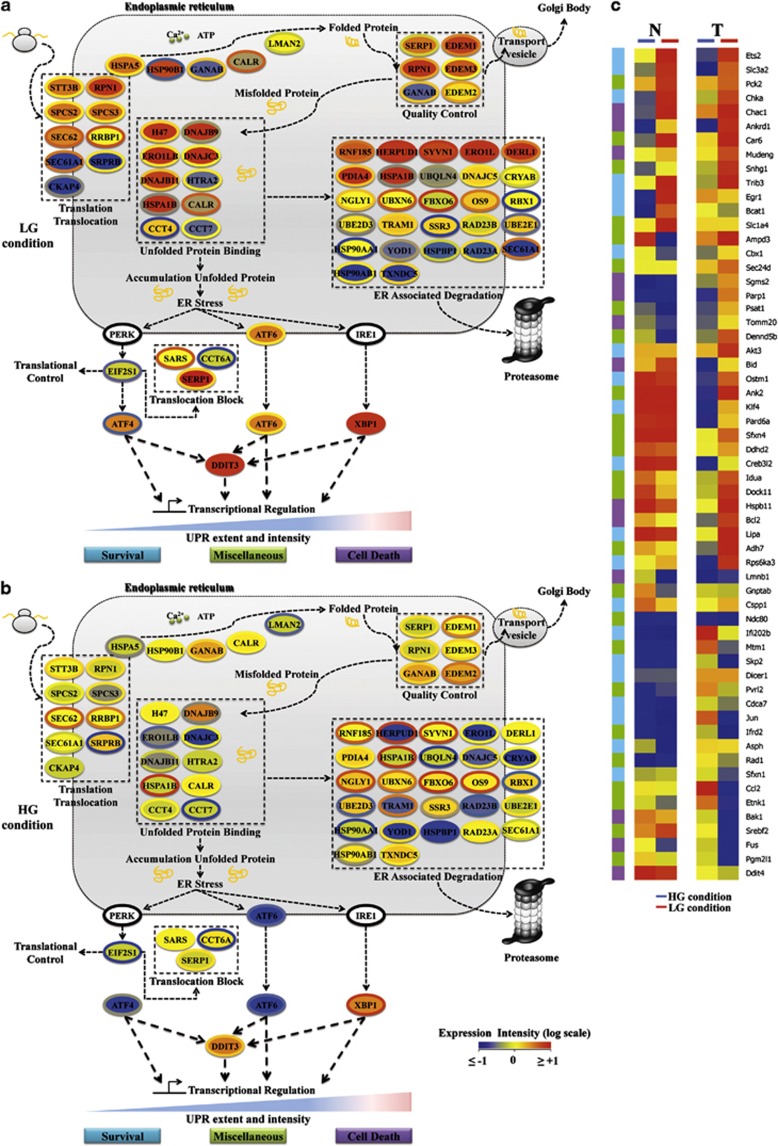
Figure 2.
The ER networks for normal and transformed cells grown in LG (a) and in HG (b), derived by using mRNA expression data at 72 h, are presented. Each mRNA is represented by a colored ellipse; in particular, the external ellipse represents normal cell data and the internal ellipse transformed cell data. Changes in gene expression levels are represented by a color log scale from red (high expression) to blue (low expression). Unchanged level of expression (yellow) has been considered when mRNA had a value between −0.5 and 0.5. The double-color triangle below the regulated processes indicated the relation between time and intensity of ER stress and effect on cell homeostasis (blue survival, red death). (c) Hierarchical clustering of 58 known UPR target genes. UPR-related genes have been identified in our transcriptional analysis and their 72 h values for normal and transformed cells grown in HG and LG have been clustered

