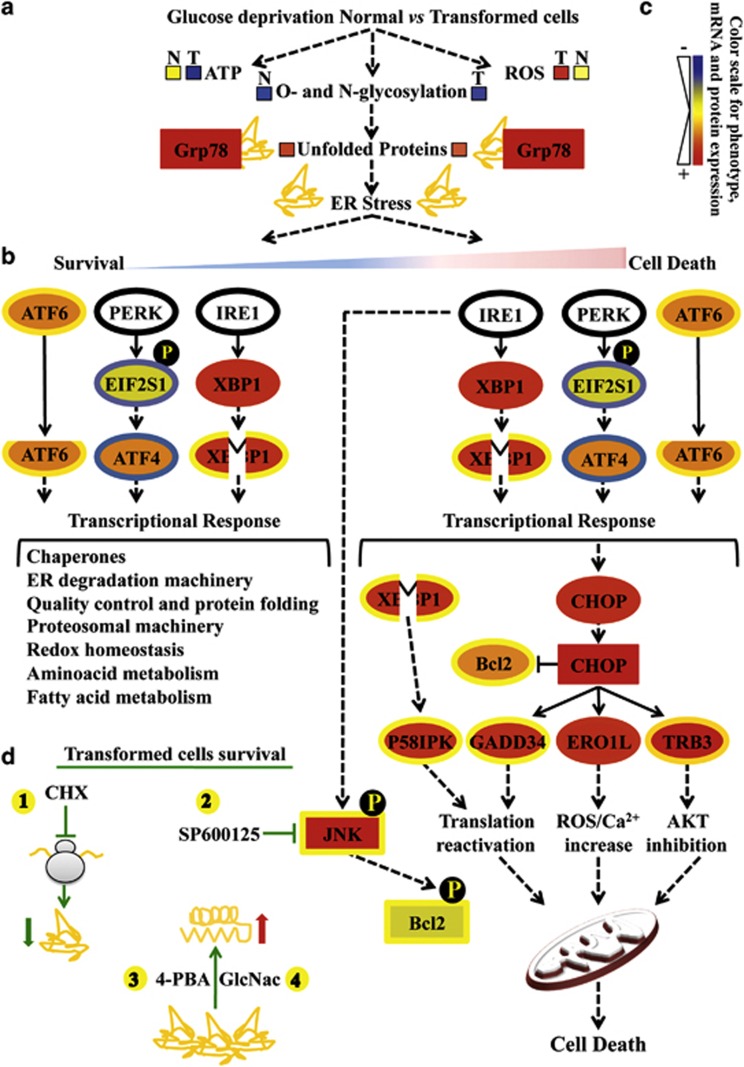
Figure 8.
Glucose deprivation in cancer cells activates UPR following HBP flux reduction. Proteins are represented by a colored rectangle; in particular, the external rectangle represents normal cell data and the internal rectangle transformed cell data. Similarly, each mRNA has been represented by a colored ellipse, in which the external ellipse represents normal cell data and the internal ellipse transformed cell data. Changes in protein and gene expression levels are represented by a color scale between red (high expression) and blue (low expression); yellow indicates unchanged expression. Levels of ATP, ROS and unfolded proteins in normal (N) and transformed (T) cells (a) are represented by colored boxes. The double-color triangle in a under ER stress indicated the relation between time and intensity of ER stress and effect on cell homeostasis (blue: survival, red: death). (b) Survival processes activated by UPR have been represented as a cascade of events starting from UPR sensors activation (ATF6 cleavage, eIF2a phosphorylation, EIF2S1 gene, by PERK, ATF4 expression and XBP1 splicing from expression upon IRE1 activity) and ending with a list of downstream regulated processes (transcriptional response). (c) The cell death process activated by UPR has been presented as a cascade of events starting from UPR sensor activation (as above) and ending either with a transcriptional response (CHOP, P58IPK, GADD34, ERO1L, TRB3) or a post-translational mechanism (phosphorylation) positively controlling JNK and negatively controlling Bcl-2 proteins. (d) Schematic representation of the transformed cells' survival mechanisms identified in our work. The protective effects of CHX (1, translation inhibition), SP600125 (2, JNK inhibitor), 4-PBA (3, chemical chaperone) and GlcNac (4, HBP substrate) are shown

