Fig. 2.
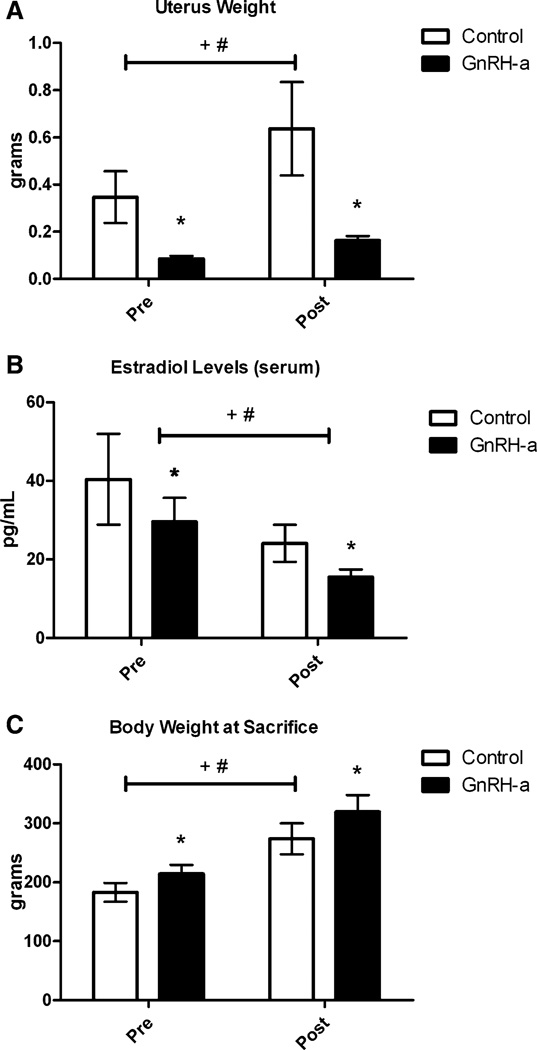
Control and GnRH-a-treated groups for both the pre and post groups for uterus weight (a), serum estradiol levels (b), and body weight at the time they were killed (c). *P< 0.05 compared with control, +P< 0.05 significant effect of experimental protocol (control vs. GnRH-a), #P < 0.05 significant effect of age (pre vs. post)

