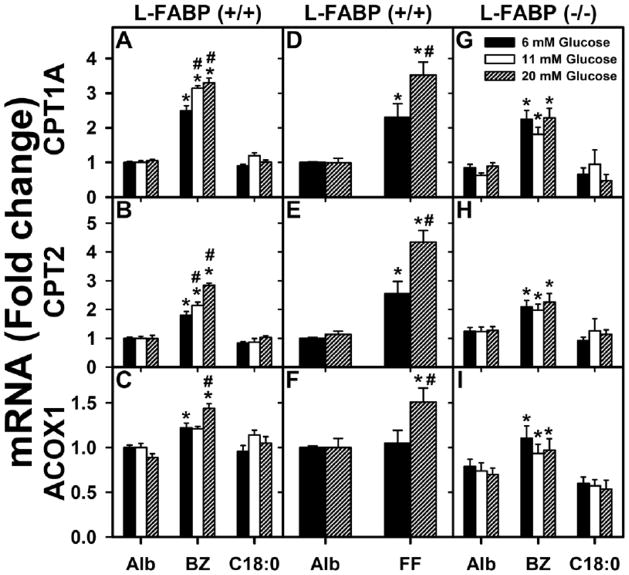
Figure 1. High glucose enhances fenofibrate- and bezafibrate-induced expression of fatty acid oxidation genes at the transcriptional level in wild-type L-FABP (+/+) but not L-FABP (−/−) mouse hepatocytes.
Fold-change in mRNA levels for CPT1A (A, D, G), CPT2 (B, E, H), and ACOX1 (C, F, I) in WT L-FABP (+/+) hepatocytes (A, B, C and D, E, F) and L-FABP (−/−) hepatocytes (G, H, I) were determined by qPCR in hepatocytes incubated with serum-free medium containing 6, 11 or 20 mM glucose and fatty acid-free albumin (Alb, 40 μM) or Alb complexed with bezafibrate (BZ, 200 μM), fenofibrate (FF, 40 μM), or stearic acid (C18:0, 200 μM) as indicated. At these levels bezafibrate and fenofibrate exhibit little toxicity to hepatocytes [59]. Mean ± standard error (SE), n= 3–4. * = p<0.05 for lipid ligand treatment vs. albumin at each glucose concentration; # = p<0.05 for 11, 20 mM glucose treatments vs. 6 mM glucose concentration within each group of lipid.

