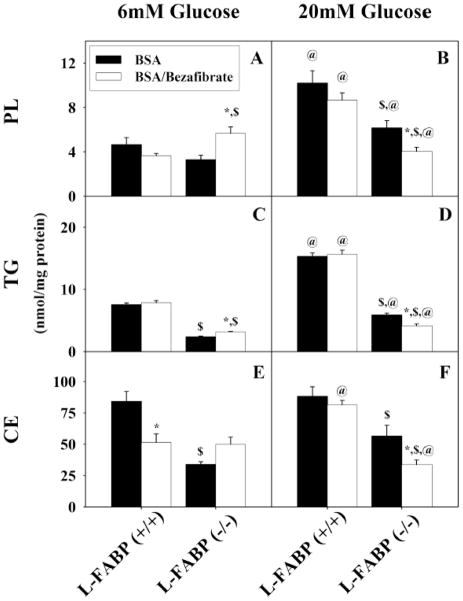
Figure 6. Esterification and secretion of stearate after uptake by mouse hepatocytes.
Incorporation and secretion of stearate in phospholipids (A, B), triacylglycerides (C, D), and cholesteryl ester (E, F) by L-FABP (+/+) and L-FABP (−/−) hepatocytes after pretreatment with BSA (black bars) or bezafibrate/BSA (open bars) and 6 mM (A, C, E) or 20 mM (B, D, F) glucose as described in Methods. Values shown as mean nmol stearate per mg protein ± standard error (n = 4 to 6). * = p<0.05 BSA vs. Bezafibrate/BSA; $ = p<0.05 L-FABP (+/+) vs. L-FABP (−/−); @ = p<0.05 6 mM glucose vs. 20 mM glucose.

