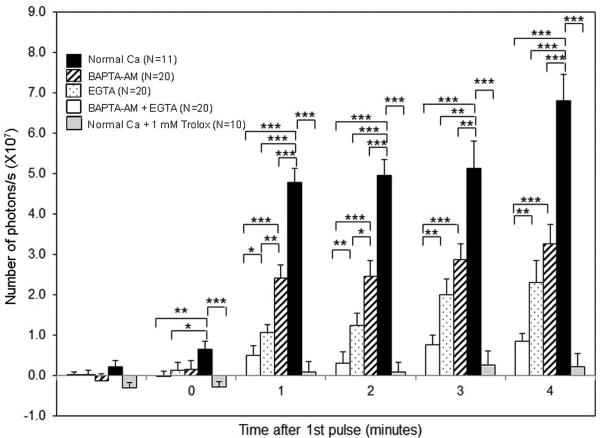
Figure 4.
Ca2+-dependence of nsPEF-stimulated ROS fluorescence. For each case, 100 pulses (100 ns, 30 kV/cm) were applied and the fluorescence was measured during 1 second of excitation light exposure to a single cell at the time indicated. The mean background signal was subtracted from each mean measured signal. The probabilities that any of the indicated pairs are not significantly different are indicated by the asterisks: * p < 0.05. **p < 0.01, *** p < 0.001. Each bar represents the mean response of at least four independent experiments and the error bars represent the SEM.

