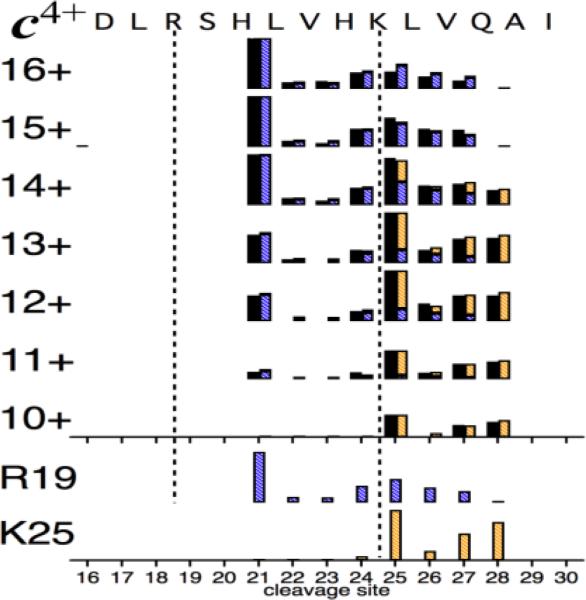
Figure 4.
Relative abundances (black bars) of c4+ fragments from ECD of KIX (M + nH)n+ ions (n = 10-16) [9]. Calculated CS spectra (bottom) for charge sites R19 and K25 give predicted abundance values shown as segmented colored bars fused on right of black bars; agreement with experimental values is 3.3 ±0.8%.

