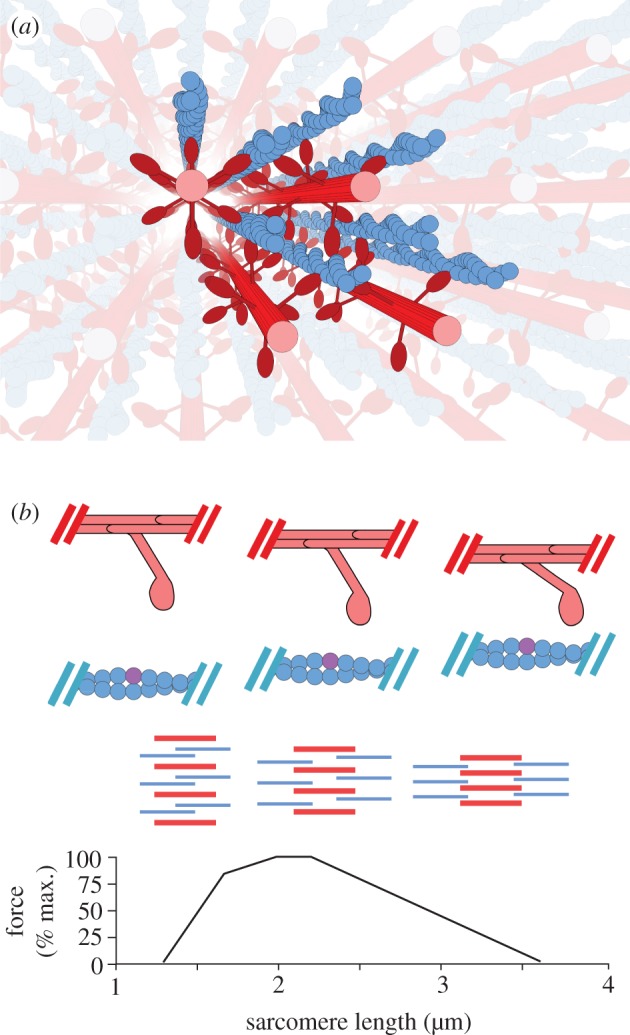
Figure 1.

(a) A spatially explicit three-dimensional multifilament model of the sarcomere generates varying levels of force as lattice spacing varies across the length–tension (LT) curve. The multifilament model of the half-sarcomere uses eight thin filaments and four thick filaments, populated by two-dimensional cross-bridge models. Simulated filaments are depicted in bold colours, and mirrored versions of those filaments which are reached by passing through a boundary are shown in light colours. Toroidal boundary conditions simulate an infinite lattice of contractile filaments, which is sensitive to changes in radial spacing. (b) Filament overlap and lattice spacing changes across the LT curve. From bottom to top, the LT curve for vertebrate skeletal muscle, a diagram of the relative degree of overlap and lattice spacing in the sarcomere across the LT curve, and a cartoon depicting the relative locations of a single cross-bridge and the thin filament across the LT curve. In the filament schematic, the thick filaments are shown in red while the thin filaments are shown in blue. The thick filaments are radially compressed from left to right, as overlap with the thin filaments decreases and sarcomere length increases. In the single cross-bridge cartoon, the lattice spacing decreases as sarcomere length grows from left to right. An example binding site is shown in purple, demonstrating in the rightmost column the geometric restriction that accompanies highly compressed lattice spacings. (Online version in colour.)
