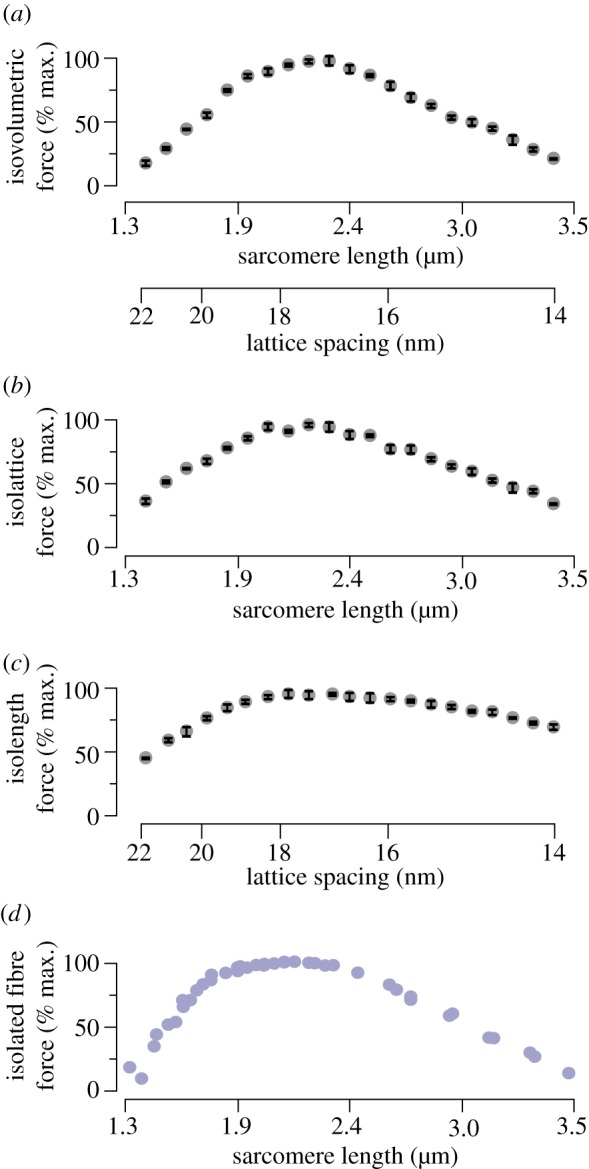
Figure 2.

Isovolumetric, isolattice and isolength force curves compared with isolated fibre measurements. (a) The force generated along a simulated isovolumetric LT curve shows the classic three-region shape. To maintain a constant lattice volume, lattice spacing changes as the square root of (1 divided by sarcomere length). Force at extreme sarcomere lengths/lattice spacings is decreased by over 75% from its peak value. Error bars depict the standard deviation of the maximal force across all trials. (b) The simulated LT curve where only sarcomere length varies, and lattice spacing is held at 17.1 nm (corresponding to a d10 lattice spacing of 36 nm), recreates more of the isovolumetric case's slope. Force decreases by over 50% at either extreme. (c) The simulated LT curve where only lattice spacing changes, and sarcomere length is fixed at 2.4 µm, shows a reduced slope. However, force decreases by more than 50% from its peak at larger lattice spacings (corresponding to short sarcomere lengths) and decreases by more than 25% at smaller lattice spacings (corresponding to long sarcomere lengths). (d) For comparison with the above, the maximum force developed by isolated frog striated muscle is presented, modified from Gordon et al. [4]. All sarcomere lengths and lattice spacings are chosen to reflect the range over which vertebrate striated muscle varies in isometric contractions along the length–tension (LT) curve [3]. (Online version in colour.)
