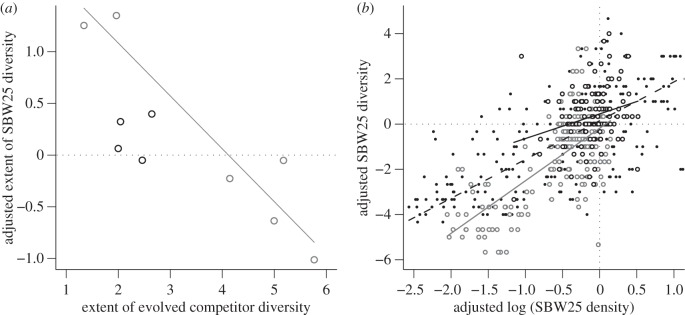
Figure 4.

(a) Adjusted extent of SBW25 diversity in the presence of DIV+ (grey circles) and DIV− (black circles) competitors, plotted against extent of evolved competitor diversity. Statistically significant regression lines are shown. (b) SBW25 diversity in the presence of DIV+ (grey open circles, grey solid line), the DIV− (black open circles, black dashed line) competitors and the absence of competitor strains (black points, black solid line) plotted against log-transformed SBW25 density. Diversity and density measures were adjusted by SBW25 density and diversity measures in the absence of competitor strains at the same time point. Lines show regression fits for each group.
