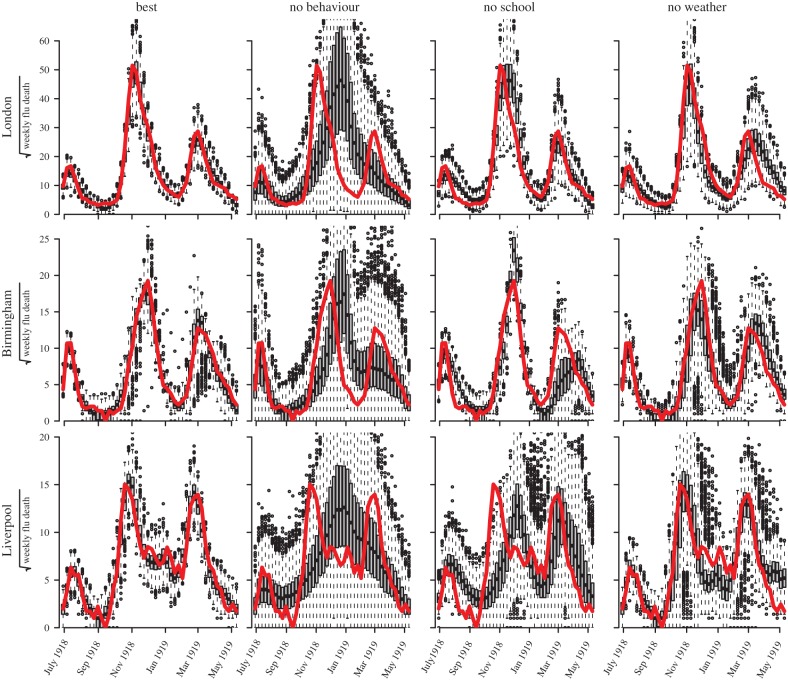
Figure 3.
Simulations compared with observed weekly mortality in 1918. We show: the best model, forced by three factors (human behavioural response, school terms and temperature); a model with no behavioural effects; a model with no school terms and a model with no temperature effects. With estimated parameter values for each model, 1000 simulations were generated (1000 × 46 weekly data points) and displayed using box-plots (one box-plot for each week), compared with observed weekly influenza mortality (46 weeks, solid (red) curve). The three rows show results for three UK cities. The four columns show the four types of model. (Online version in colour.)

