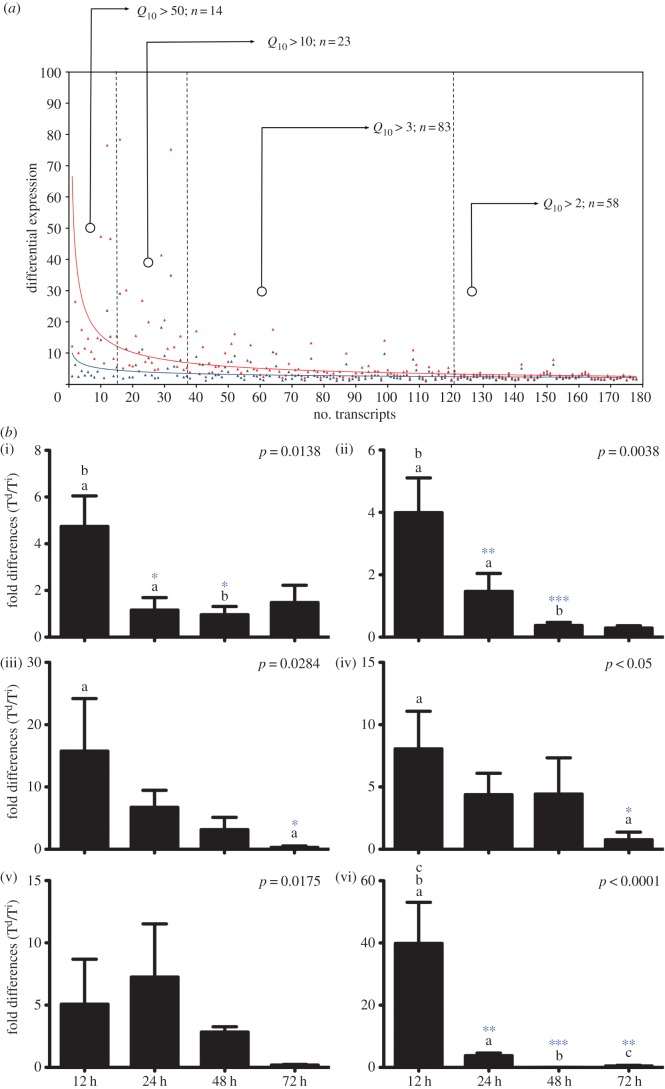
Figure 2.
Gene–environment interaction during dsRNA-induced behavioural fever. (a) Differential expression levels of 156 (fold change greater than 2) dsRNA-induced transcripts common to both constant conditions (Ti) or in a thermal gradient (Td). Q10 values were calculated and shown in four groupings relative to intensity. Solid curves, red (Td) or blue (Ti) denote specific mRNA abundances relative to environmental condition. (b) qRT-PCR quantification of specific anti-viral mRNA accumulation over a 72 h time period post-dsRNA challenge. Values shown are maximal mRNA relative abundance ratio (Td/Ti) in dsRNA challenged fish (n = 6) mean ± s.d. Two-way ANOVA: (i) Stat-1a, (ii) Stat-1b, (iii) Irf7, (iv) Gig2, (v) Trim25 and (vi) Somatostatin (interaction values). Letters represent comparisons (a,b,c) and significance is Bonferroni post-hoc test (*p < 0.05; **p < 0.01; ***p < 0.001).

