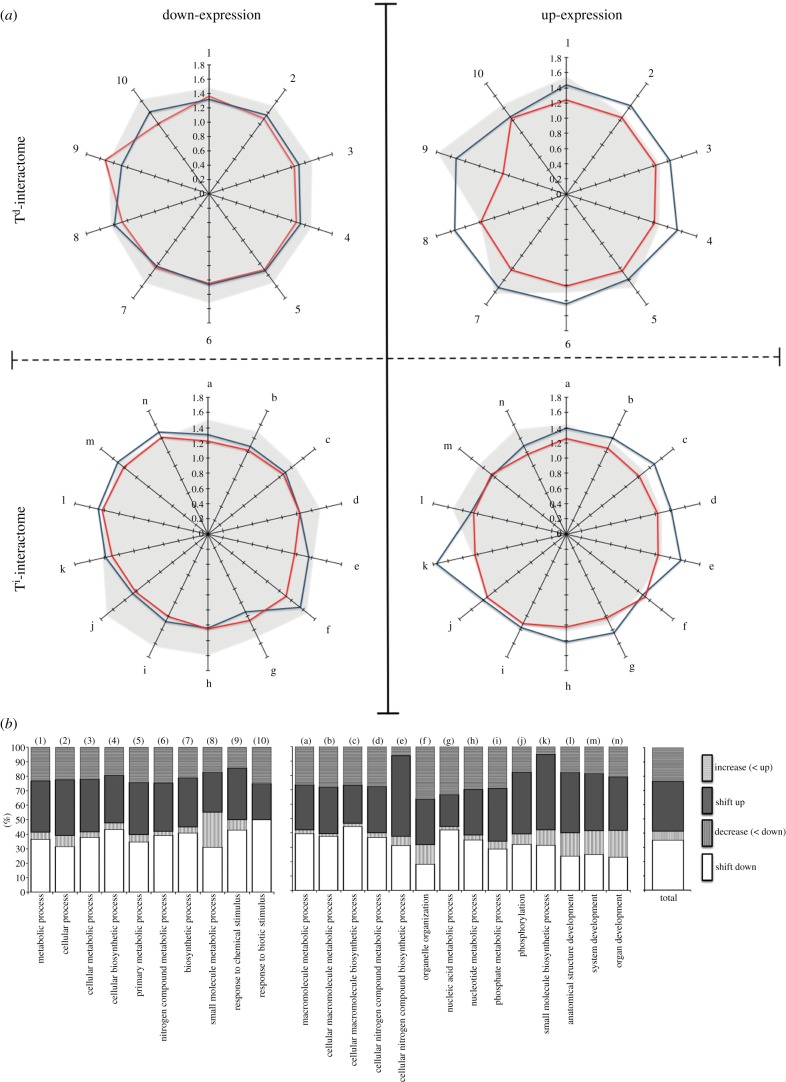
Figure 3.
Temperature-dependent effects on transcriptome regulation. (a) Variation in total transcript abundance (insets; vertical axis = mean expression intensity over control interactome, one-tail ANOVA; F7,99 = 6.833, p < 0.0001) scores derived from Td and Ti interactome GO clusters (p < 0.05). Interactome numbering (1–10) and lettering (a–n) represents Td and Ti clusters, respectively, term description is in figure 2b. (b) Percentile representation of temperature dependent (Td versus Ti) directional shift (black and white bars represent up- and downregulated transcripts, respectively) and percentile increase of mean transcript abundance (horizontal or vertical etched bars represent % increase or decrease, respectively) in dsRNA-activated functional clusters.

