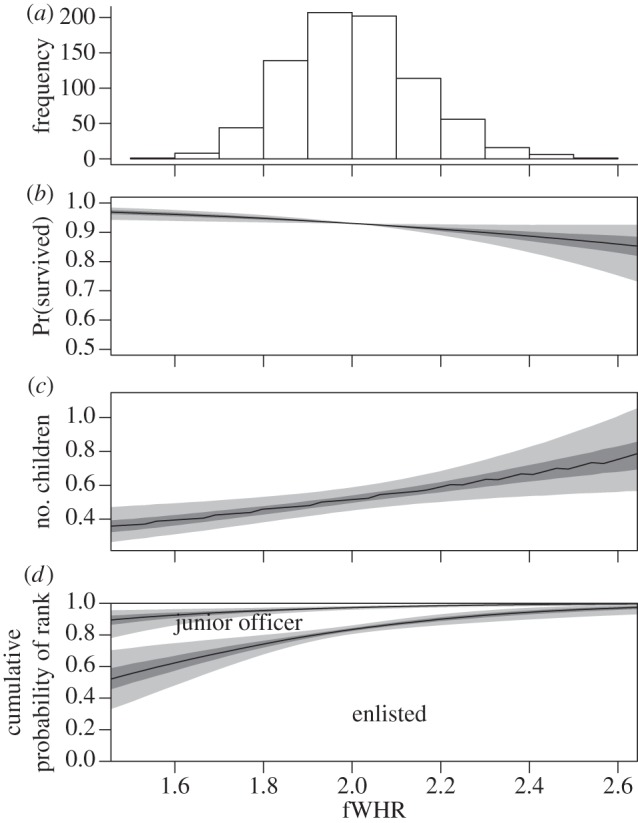
Figure 2.

Finnish troops who participated in the Winter War 1939–1940 and the distribution of (a) scaled fWHR, (b) predicted probability of surviving the Winter War (adjusted so the posterior mode at mean face width is 0.85). Figure contains all 795 individuals, see the electronic supplementary material, S3 for figure with three main regiments only. (c) Total number of children for fallen soldiers and (d) probability of attaining a rank depending on fWHR. Facial width increases with values (for an enlarged version of figure 2c see electronic supplementary material, S4). Dark shaded area represents 50% highest posterior density region and light shaded area represents 95% highest posterior density region.
