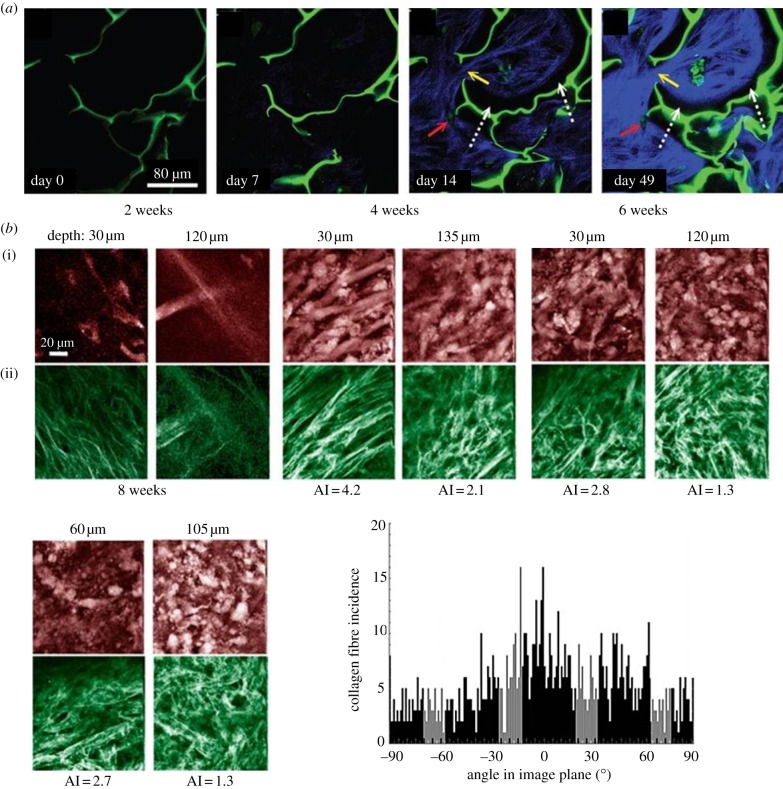
Figure 8.
Timeline and SHG imaging of collagen I production. (a) Multiphoton images from human MSCs cultured in a chitosan scaffold that were induced to undergo chondrogenesis (TGF-β3) for up to seven weeks [109]. Images were acquired at a depth of 15 µm. Two-photon AF is represented in green (scaffold boundaries and cells) and SHG in blue (produced collagen I). The cells massively produce ECM after two weeks. The lack of contact between the induced collagen fibres and the chitosan scaffold is shown by the white dashed arrows, and the linkages formed by the collagen from adjacent chitosan domains are shown by the yellow arrows. The red arrows show the lacunae-like structures that have been formed within collagen clusters, with autofluorescent cells inside. (b) Collagen fibre orientation analysis. NLOM images of constructs from two to eight weeks of culture. Pseudo-coloured images of PGA polymer and smooth muscle cells (AF, red (i)) and collagen fibres (SHG, green (ii)). Fibres of PGA scaffold were clearly visible at two and four weeks, with collagen deposition running parallel to PGA fibres. From four to eight weeks, local collagen alignment with PGA fibres decreased as the PGA degraded, as revealed by an alignment index (AI) computed for the collagen fibres at weeks four to eight. Depth of image acquisition is shown in micrometres. The scale bar (20 µm) applies to all images. The histogram (bottom left) shows a projection of all collagen fibre angles from the eight week specimen [136].

