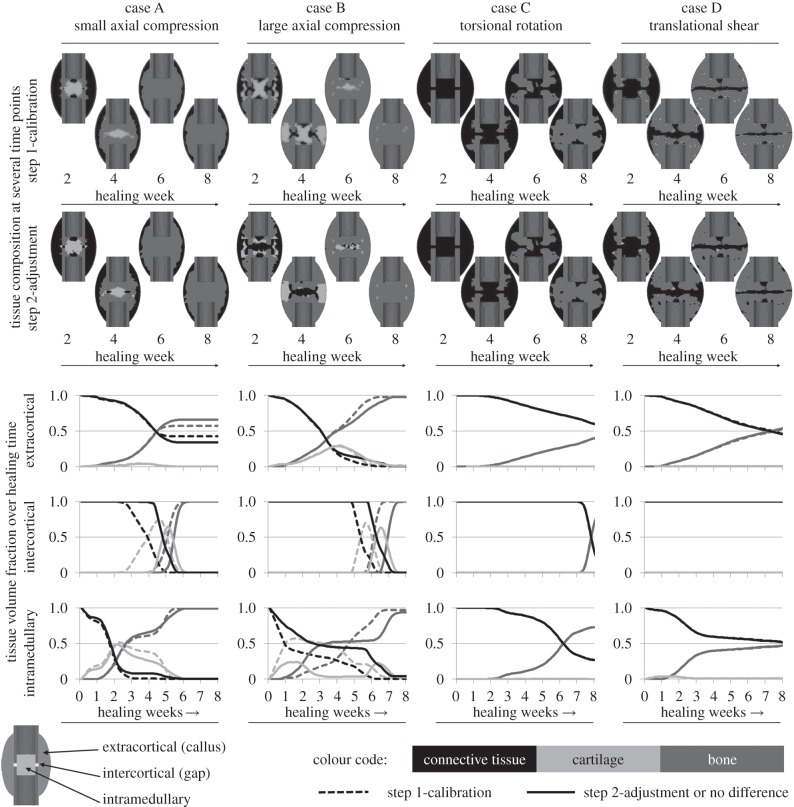
Figure 3.
Tissue distribution for the four calibration load cases. The first and second row of callus sketches show the tissue composition within the fracture calluses at several time points during the process of healing for the step 1-calibration and the step 2-adjustment, respectively. The diagrams show the change of volume fraction of each tissue over the healing time for three different callus regions: extracortical (top row), intercortical (centre row) and intramedullary (bottom row) according to the outline on the bottom left. Black colour represents connective tissue which is present in the callus in the beginning of the healing phase and turns into fibrous tissues in later phases. Light grey colour represents cartilaginous tissue developed prior to endochondral ossification and dark grey colour represents bony tissue (i.e. cortical bone, woven bone and calcified cartilage). Dashed lines indicate results for the step 1-calibration, solid lines for the step 2-adjustment or if no differences between both can be detected.

