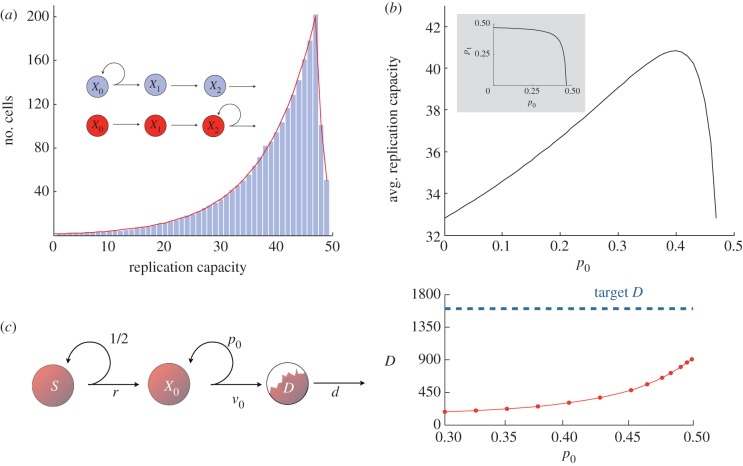
Figure 3.
(a) Distribution of the replication capacity of dividing cells (k = 2, r = 1, vj = 1, S = 50, ρ = 50, p0 or p2 = 0.45). Here self-renewal occurs only in one transit-amplifying cell compartment. Bar plots are produced using the agent-based model and allowing for self-renewal only in compartment 0. Red line is produced using the analytical model allowing for self-renewal only in compartment 2. The distribution does not change when the non-zero self-renewal probability is switched from compartment 0 to compartment 2. See proposition 5.2. (Stem cell and differentiated cell compartments are not depicted in the inset.) (b) Replication capacity of the entire cell population at equilibrium as a function of p0 (k = 1, v = 1, dD − rS = 1716, ρ = 50). Given that dD − rS is fixed the value of p0 = 0 determines the value of p1 (see inset). Note that the minimum occurs when there is self-renewal in only one of the compartments (i.e. p0 or p1 is equal to zero). See lemma 5.4. (c) It is not always possible to reach a specified target number of divisions with only one intermediate compartment. Here, the number of differentiated cells produced by a system with a single intermediate compartment is incapable of producing the target number of differentiated cells (indicated by a half-filled compartment D). In this case, rS = 50, D = 1600, d = 1 and ρ = 20. Results were obtained using the agent-based model. (See text for discussion.)

