
Figure 5.
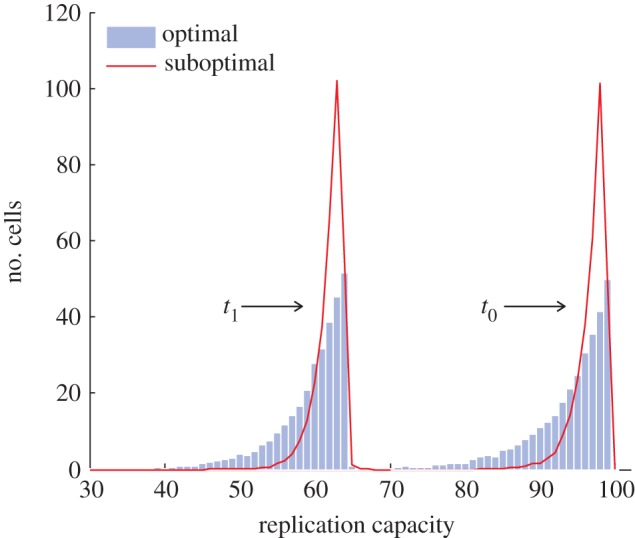
Distribution of the replication capacity of dividing cells for the case when the stem cell replication capacity diminishes with time. Results from two alternative cell lineage architectures for the same target number of intermediate cell divisions are presented. The distributions are shown at two different times t0 = 0 and t1 = 3500. (Units of time equal the mean cell division time of stem cells.) In both cell lineages, all vj = 1, r = 1, S = 50 and ε = 0.02. In the optimal architecture (bars), k = 0 and p0 = 0.42; in the suboptimal architecture (lines), k = 1, p0 = 0.31 and p1 = 0.31. (Online version in colour.)