
Figure 2.
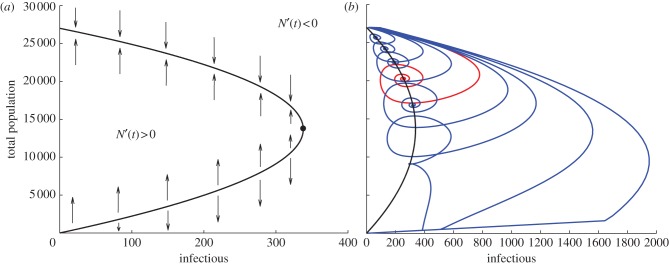
(a) N-nullcline and stability for constant values of infectious: the upper branch of the curve is stable, whereas the lower one is unstable. (b) Trajectories in the phase plane (N,I) associated with different temporal dynamics of the new infectious Φ = ζ × (σE), with ζ = 0.25, 0.5, 0.75, 1, 1.25, 1.5, 1.75, 2, and σE from the complete SEI model. In red, we highlight the trajectory asociated with ζ = 1, corresponding to the one of the complete SEI model.