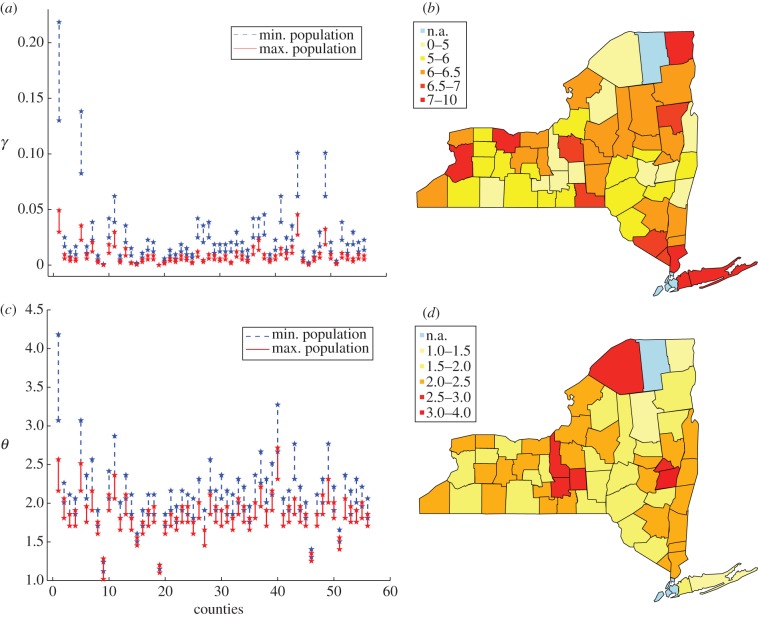
Figure 6.
(a,c) Compatibility intervals for minimal and maximal initial raccoon population for the 56 New York counties with reported positive cases. Counties are numbered in alphabetical order matching table 1. (a) Constant surveillance, (c) dynamic surveillance. (b,d) Maps of surveillance risk and efficacy for the 56 New York counties with reported positive cases. (b) Surveillance risk map associated with constant surveillance. Small values indicate an high level of surveillance in the region, whereas large values entail a significant risk of an epidemic going undetected in the area. (d) Surveillance efficacy map associated with dynamic surveillance. Large values indicate a high level of surveillance in the area, whereas small values highlight a significant risk that an epidemics can go undetected in the region.

