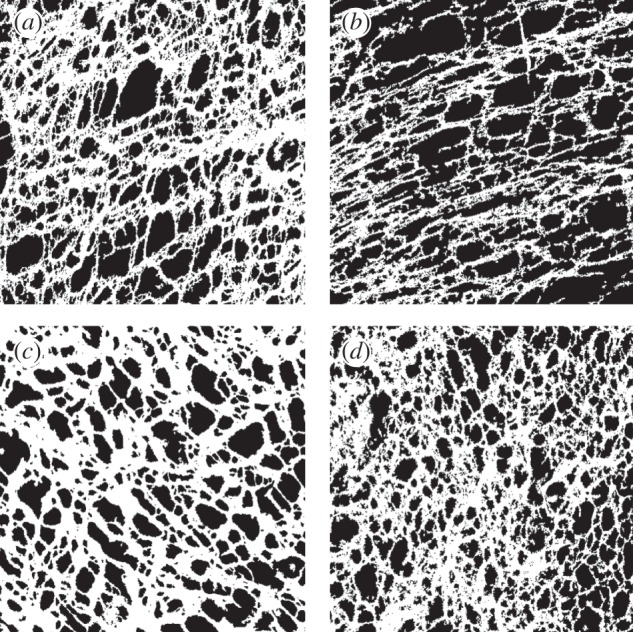
Figure 2.

Representative ICC network images for each group of the datasets, as objectively defined by having metric values near the median of the group. Shown are 4-week-old (a) WT and (b) KO from 5-HT2B receptor dataset, with physical dimensions of 0.318 × 0.318 mm, and 3-day-old (c) WT and (d) KO from Ano1 dataset, with physical dimensions of 0.212 × 0.212 mm. The white represents ICC, while the black represents non-ICC regions.
