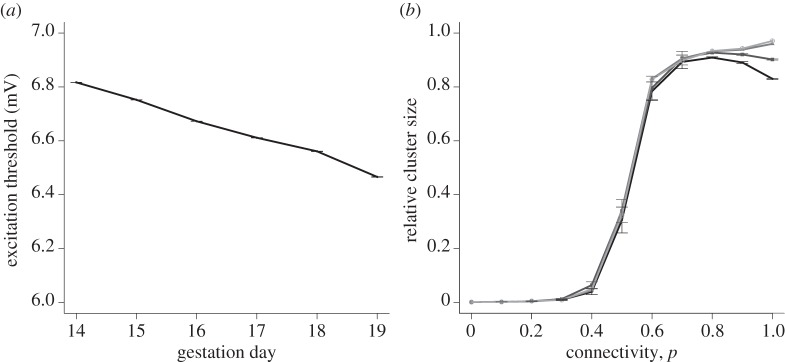
Figure 10.

(a) Excitation threshold a cell needs to overcome versus the gestation day. The points from day 15 and day 18 gestations are determined by experimental data. Other points are generated by interpolation and extrapolation based on a linear relationship between day 15 and day 18 data. All points show mean ± s.e.m. of 100 simulations. (b) Relative cluster size versus connectivity, for an initial perturbation of 1. All points show mean ± s.e.m. of 100 simulations, for a lattice size of 25 × 25. There is no asymmetry due to cell capacitance variation: κ = 1. Lines represent simulations incorporating pre-day 15 variation, day 15 variation, day 18 variation and post-day 18 variation on a graded scale from dark to light.
