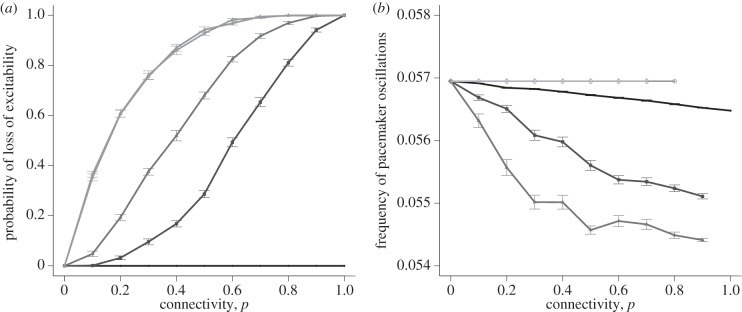
Figure 12.

(a) Probability that the pacemaker cell becomes inactivated versus connectivity, for a selection of coupling strengths. All points show the number of times excitation was not maintained in 50 simulations as mean ± s.e.m. of 15 repetitions. Lattice size is 25 × 25. Lines represent coupling strengths of 0.1, 0.5, 1, 5 and 10 on a graded scale from dark to light. Coupling strengths of 5 and 10 are shown in the same shade due to their close proximity. (b) Frequency of oscillations of the pacemaker cell versus connectivity, for a selection of coupling strengths. All points show mean ± s.e.m. of 100 simulations where excitability of the pacemaker cell was maintained, for a lattice size of 25 × 25. Lines represent coupling strengths of 0.1, 0.5, 1, 5 and 10 on a graded scale from dark to light. The gaps in the individual lines illustrate where the pacemaker cannot maintain excitability.
