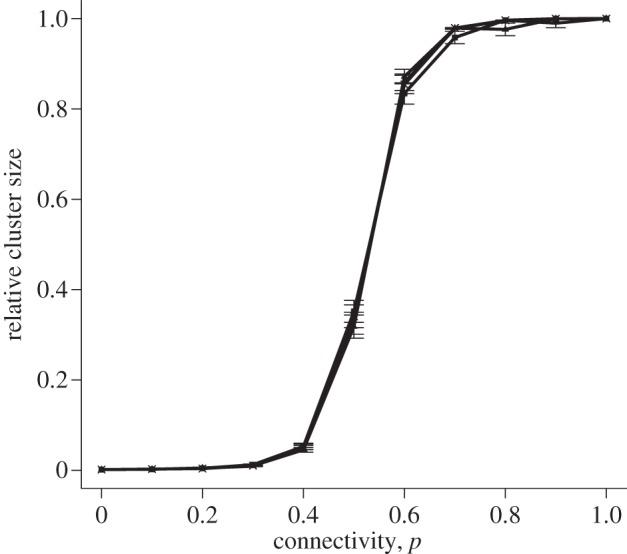
Figure 4.

Relative cluster size versus connectivity for symmetrical coupling in the Bernoulli lattice. Points show mean ± s.e.m. of 100 simulations for a 25 × 25 lattice. In all simulations, a coupling strength of κ = 1 was chosen. The four lines represent initial perturbations of 1, 1.5, 2 and 2.5, shown in the same colour due to the proximity of the curves.
